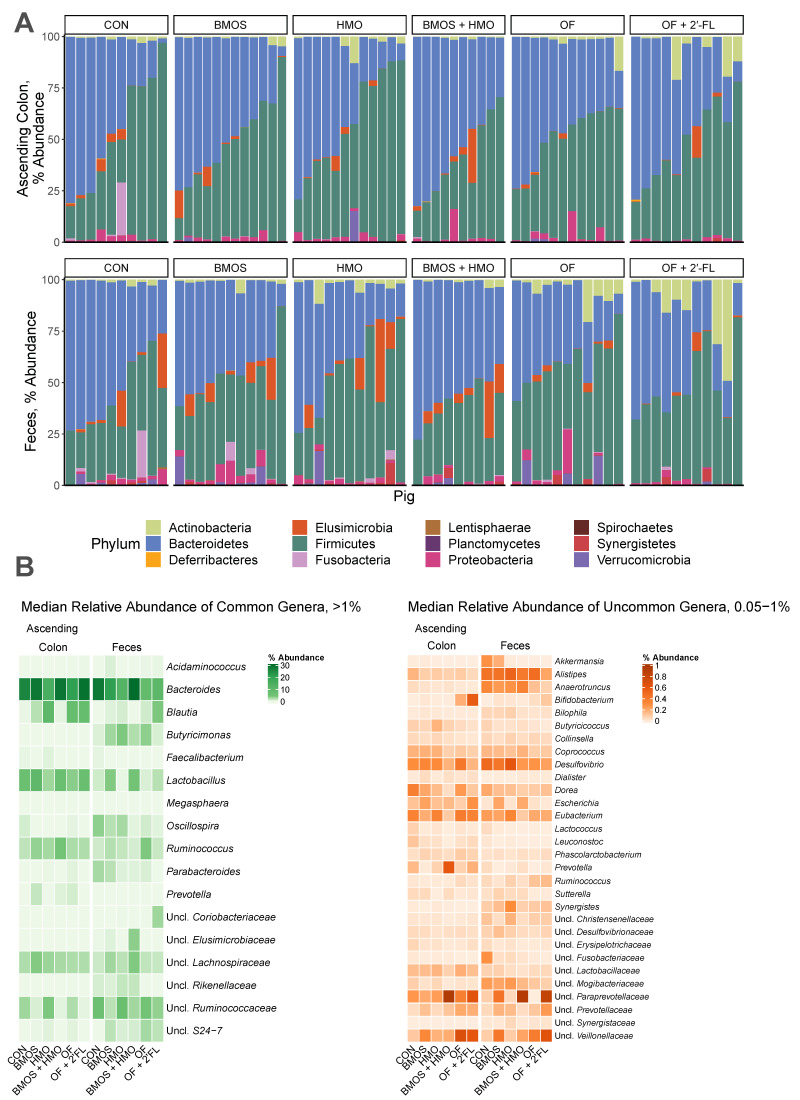
Figure 2.
(A) Relative abundance of taxa at the phylum level in the ascending colon and feces. Each bar represents an individual pig. (B) Relative abundance of common and uncommon taxa at the genera level. Groups with a median abundance less than 0.05% for any given taxa are not shown. Abbreviations: Uncl., unclassified; CON, control group; HMO, pigs fed human milk oligosaccharides; BMOS, pigs fed bovine milk oligosaccharides; BMOS + HMO, pigs fed both human and bovine milk oligosaccharides; OF, pigs feds oligofructose; OF + 2′-FL, pigs fed oligofructose and 2′-fucosyllactose.

