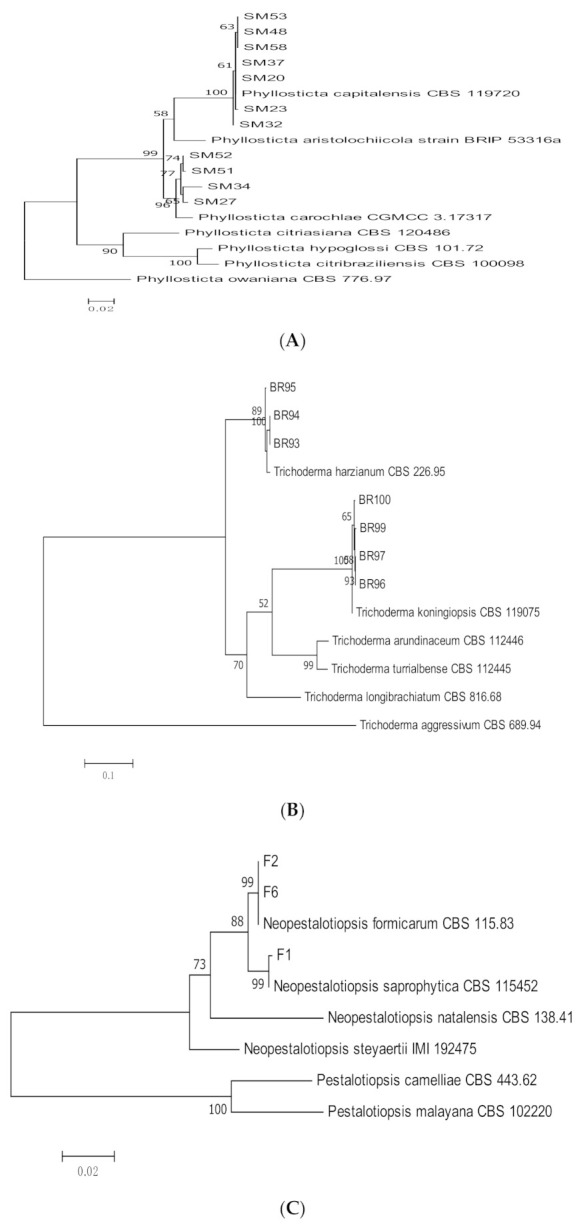
Figure 4.

Maximum likelihood tree inferred from combined sequences of ITS and TEF-1α for (A) Phyllosticta spp., (B) Trichoderma spp., and (C) Neopestalotiopsis spp. from C. castaneus spines with bootstrap values higher than 50% are shown next to the branches.
