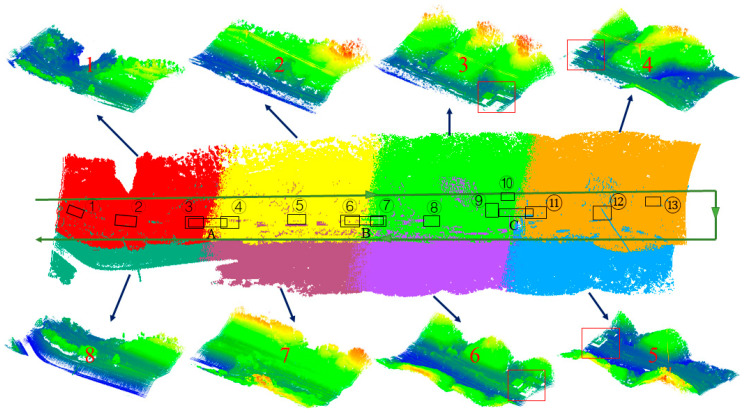
Figure 4.
Strip data and serial number after preprocessing. There are continuous hills, undulating terrain, an expressway, an ordinary road, a high-voltage power line, and a toll station (in red rectangles). A more complete experimental region can be seen in Figure 5. The green line is the flight trajectory of the unmanned aerial vehicle (UAV) and the black rectangles mark the position of the planes used to calculate the root-mean-square error (RMSE) in subsequent experiments.

