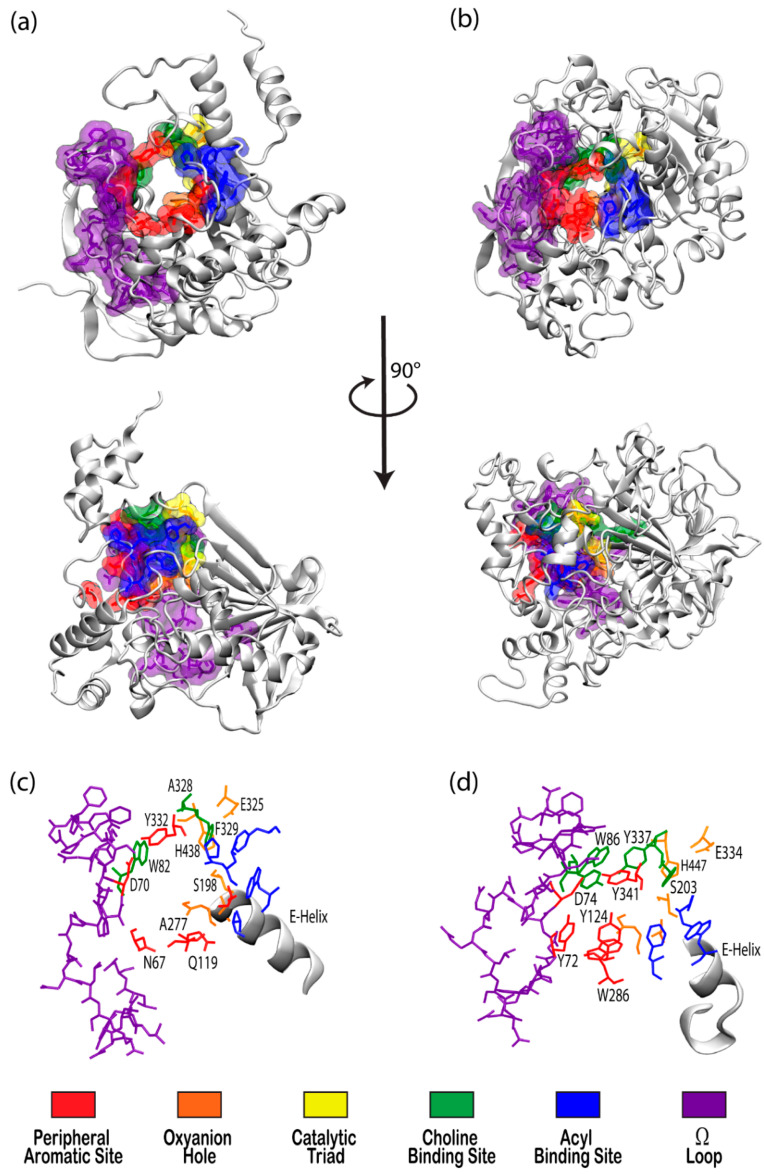
Figure 1.
Visualizations of (a) butyrylcholinesterase (BChE) (PDBID 1P0I) and (b) acetylcholinesterase (AChE) (PDBID 1B41) in white ribbon mode with residues in notable binding sites shown as semi-transparent van der Waals surfaces colored according to the key. Top panels present views directly into the active site gorges with structures in the center panel rotated 90° about the vertical axis. Bottom panels present magnified views of the binding site regions of (c) BChE and (d) AChE with key residues labeled.

