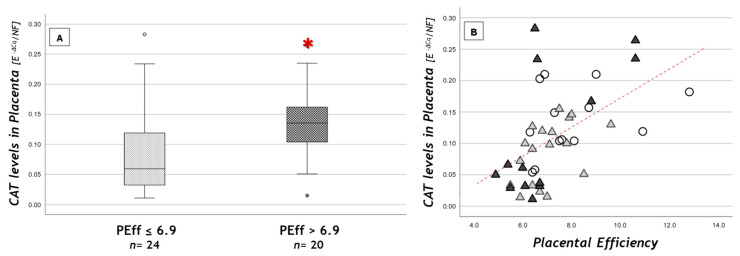
Figure 2.
CAT placental levels (A) according to placental efficiency (PEff) cut-off and (B) in relation to PEff. (A) Data are shown as box plots, indicating the median and the 25th and 75th percentiles; ° values that extend more than 1.5 box-lengths from the edge of the box. * p < 0.05 (t-test); (B) statistical analysis by the Spearman rank order correlation (r = +0.6, p < 0.001) in NW (○), OB GDM(−) (▲), OB GDM(+) (▲).

