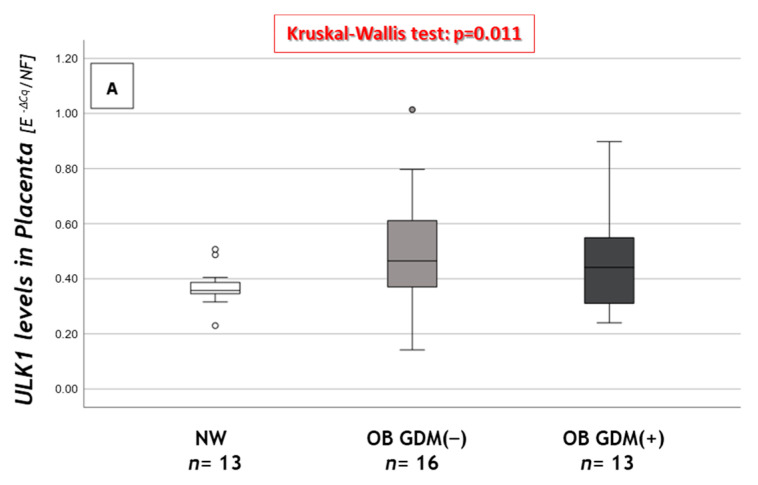
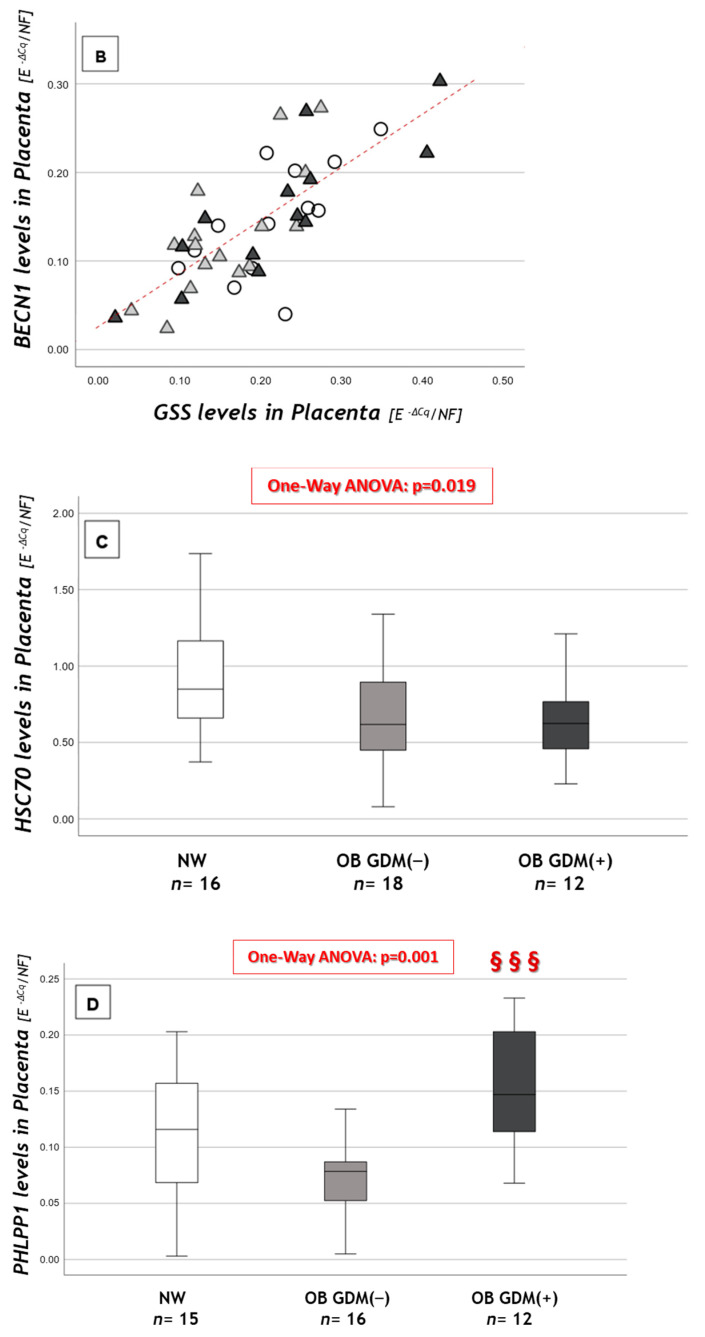
Figure 3.
Expression of macroautophagy and CMA genes in placental tissue. (A) ULK gene expression levels, (B) correlation between GSS and BECN1 placental levels, (C) HSC70 gene expression levels and (D) PHLPP1 gene expression levels among NW, OB GDM(−) and OB GDM(+). (A,C,D) Gene expressions were analyzed with Kruskal–Wallis test or One-way ANOVA (ULK1: p = 0.011; HSC70: p = 0.019; PHLPP1: p = 0.001). Data are shown as box plots, indicating the median and the 25th and 75th percentiles; ° values that extend more than 1.5 box-lengths from the edge of the box. §§§ p ≤ 0.001 vs. OB GDM(−) (all Tukey HSD post hoc tests, except for ULK analyzed with Mann–Whitney U test and Bonferroni correction). (B) Statistical analysis by the Spearman rank order correlation (r = +0.76, p < 0.001) in NW (○), OB GDM(−) (▲), OB/GDM(+) (▲).


