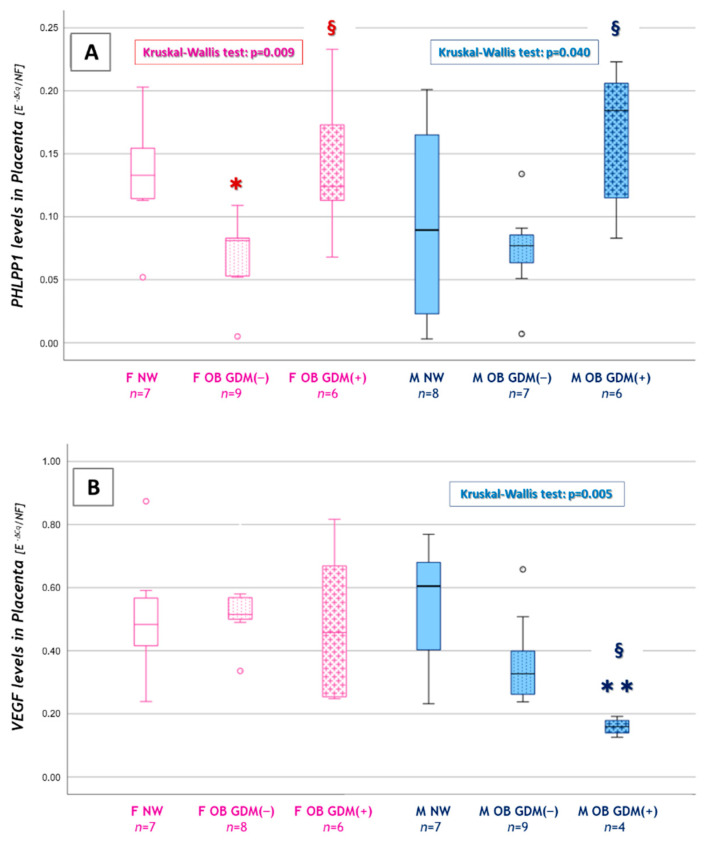
Figure 5.
Sexually dimorphic expression of CMA or autophagy-related genes. (A) PHLPP1 and (B) VEGF levels among female or male placentas in NW, OB GDM(−) and OB GDM(+). Data were analyzed with Kruskal–Wallis test (PHLPP1: p = 0.009 for FEMALE placentas, p = 0.040 for MALE placentas. VEGF: p = 0.005 for MALE placentas). Data are shown as box plots, indicating the median and the 25th and 75th percentiles; ° values that extend more than 1.5 box-lengths from the edge of the box. FEMALE Placentas: * p < 0.05 vs. NW or § p < 0.05 vs. OB GDM(−). MALE Placentas: ** p < 0.01 vs. NW or § p < 0.05 vs. OB GDM(−); post-hoc by Mann–Whitney U test with Bonferroni correction.

