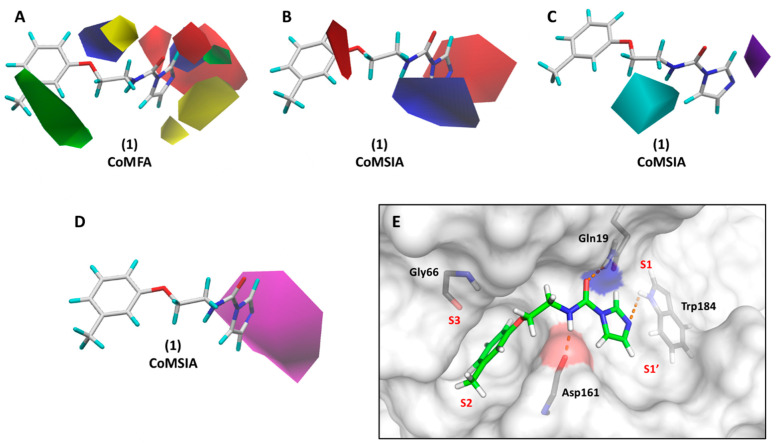
Figure 8.
3D StDev*Coeff CoMFA and CoMSIA contour maps for compound 1. (A) CoMFA steric and electrostatic contour maps; (B) CoMSIA electrostatic contour maps; (C) CoMSIA hydrogen-bond donor contour maps; (D) CoMSIA hydrogen-bond acceptor contour maps; (E) predicted binding conformation of compound 1. Compound 1 and cruzain binding site residues are depicted as sticks. Cruzain is shown as a surface, with Asp161 highlighted in red and Gln19 highlighted in blue. Hydrogen bonds are shown as dashed lines. Green and yellow plots: Bulky groups are favorable and unfavorable to activity, respectively. Blue and red contours: Positive and negative groups, respectively, are favorable to activity. Cyan and purple plots: Hydrogen bond donors are favorable and unfavorable to activity, respectively. Magenta: Hydrogen-bond acceptors are favorable to activity.

