
Fig. 2.
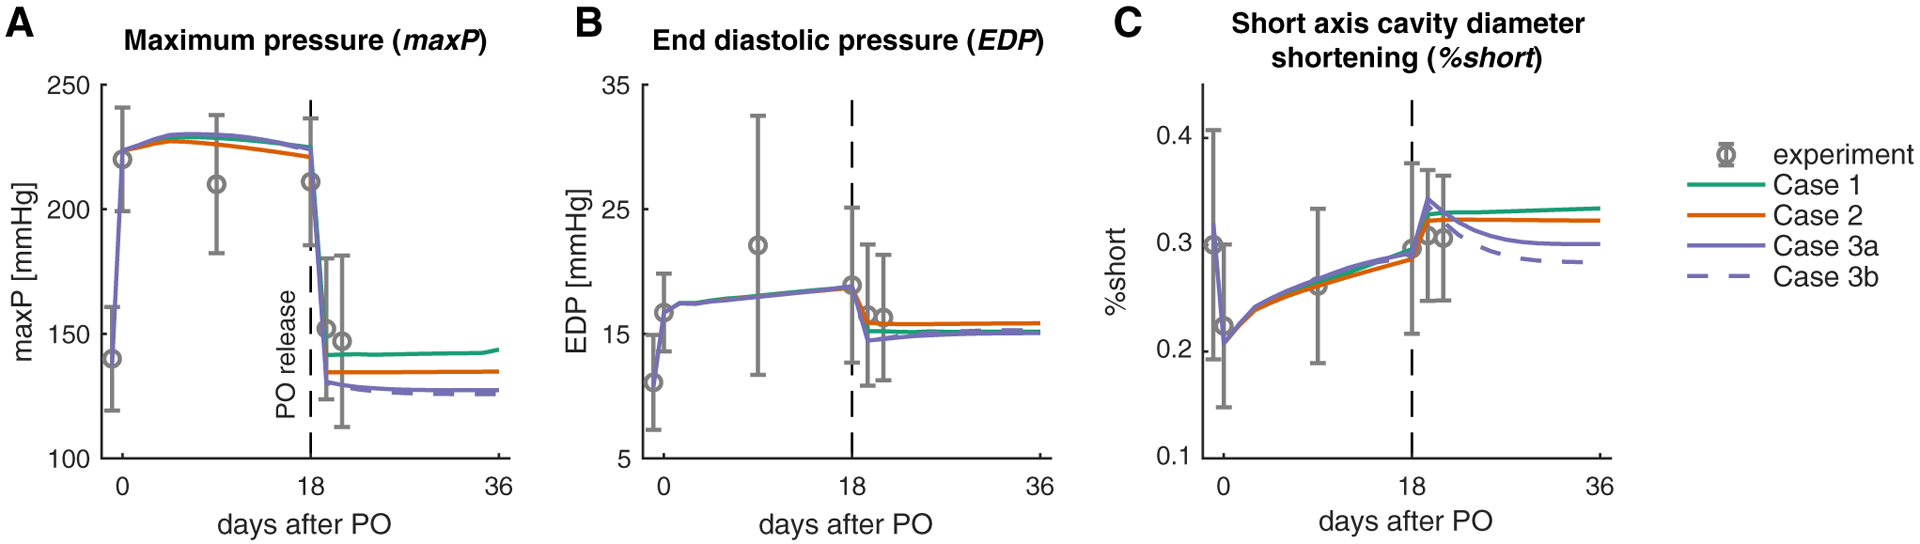
Model quantitatively matches the reported time course of hemodynamics for baseline (day −1.5), acutePO (day 0), forward growth (day 0–18), and at PO release (day 19.5). Figures show comparisons of the different simulated cases to data for a maximum LV pressure, b end-diastolic pressure, and c % shortening