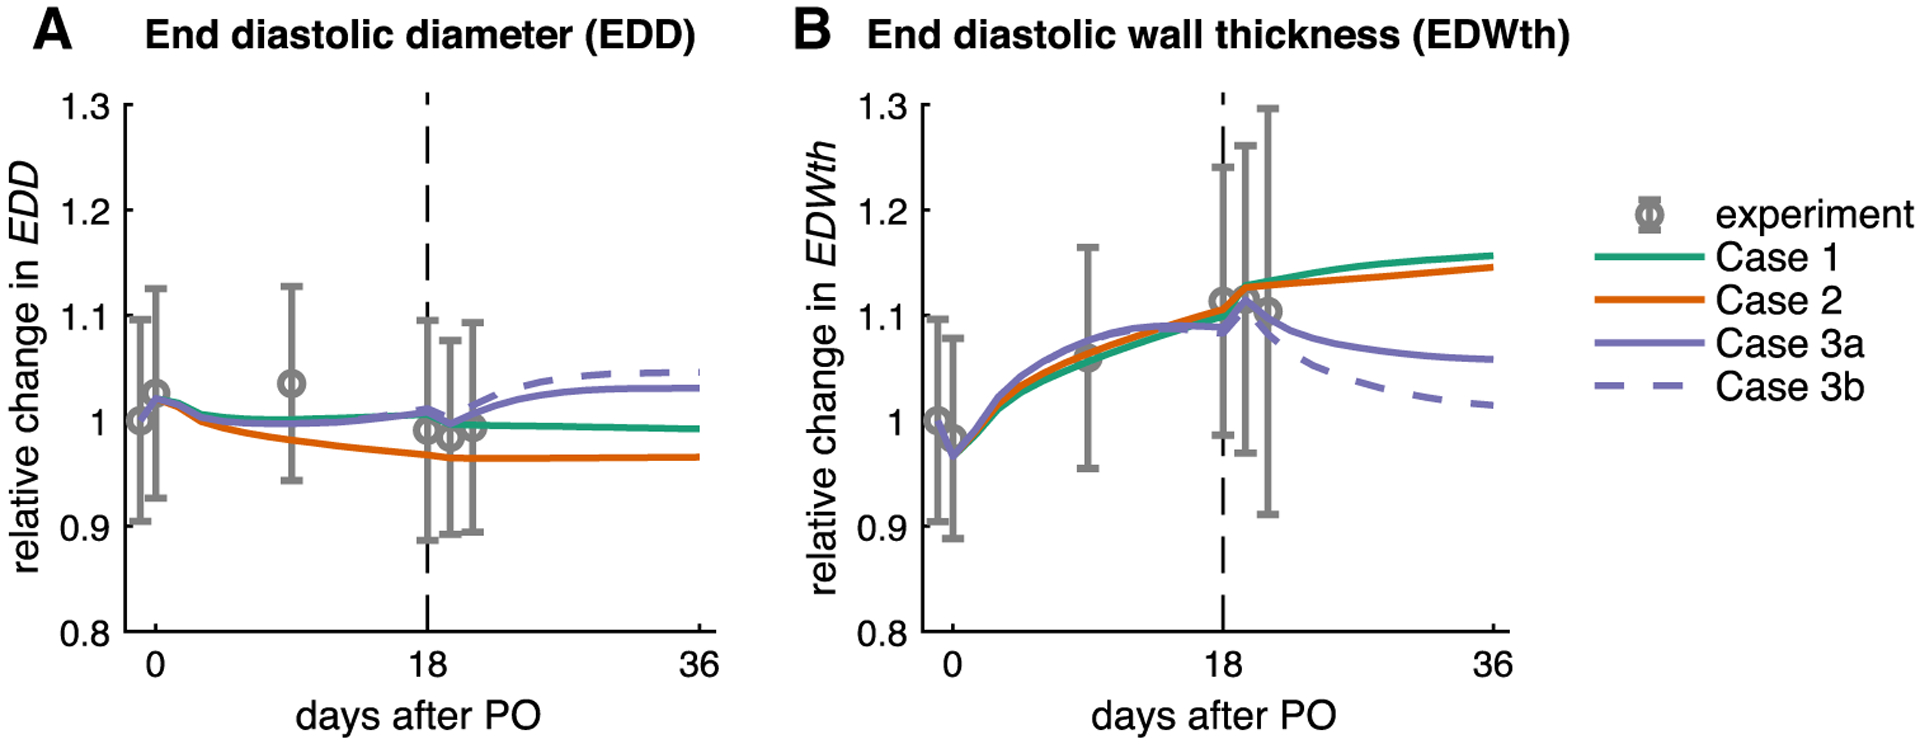
Fig. 3.

Model quantitatively matches the reported time course of remodeling for baseline (day −1.5), acutePO (day 0), and forward growth (day 0–18). Figures show comparisons of the four different simulated cases to data for a end-diastolic diameter (EDD) and b end-diastolic wall thickness (EDWth). Following PO release, only the simulations with an evolving setpoint (Cases 3a and 3b) predicted regression of wall thickening (see text)
