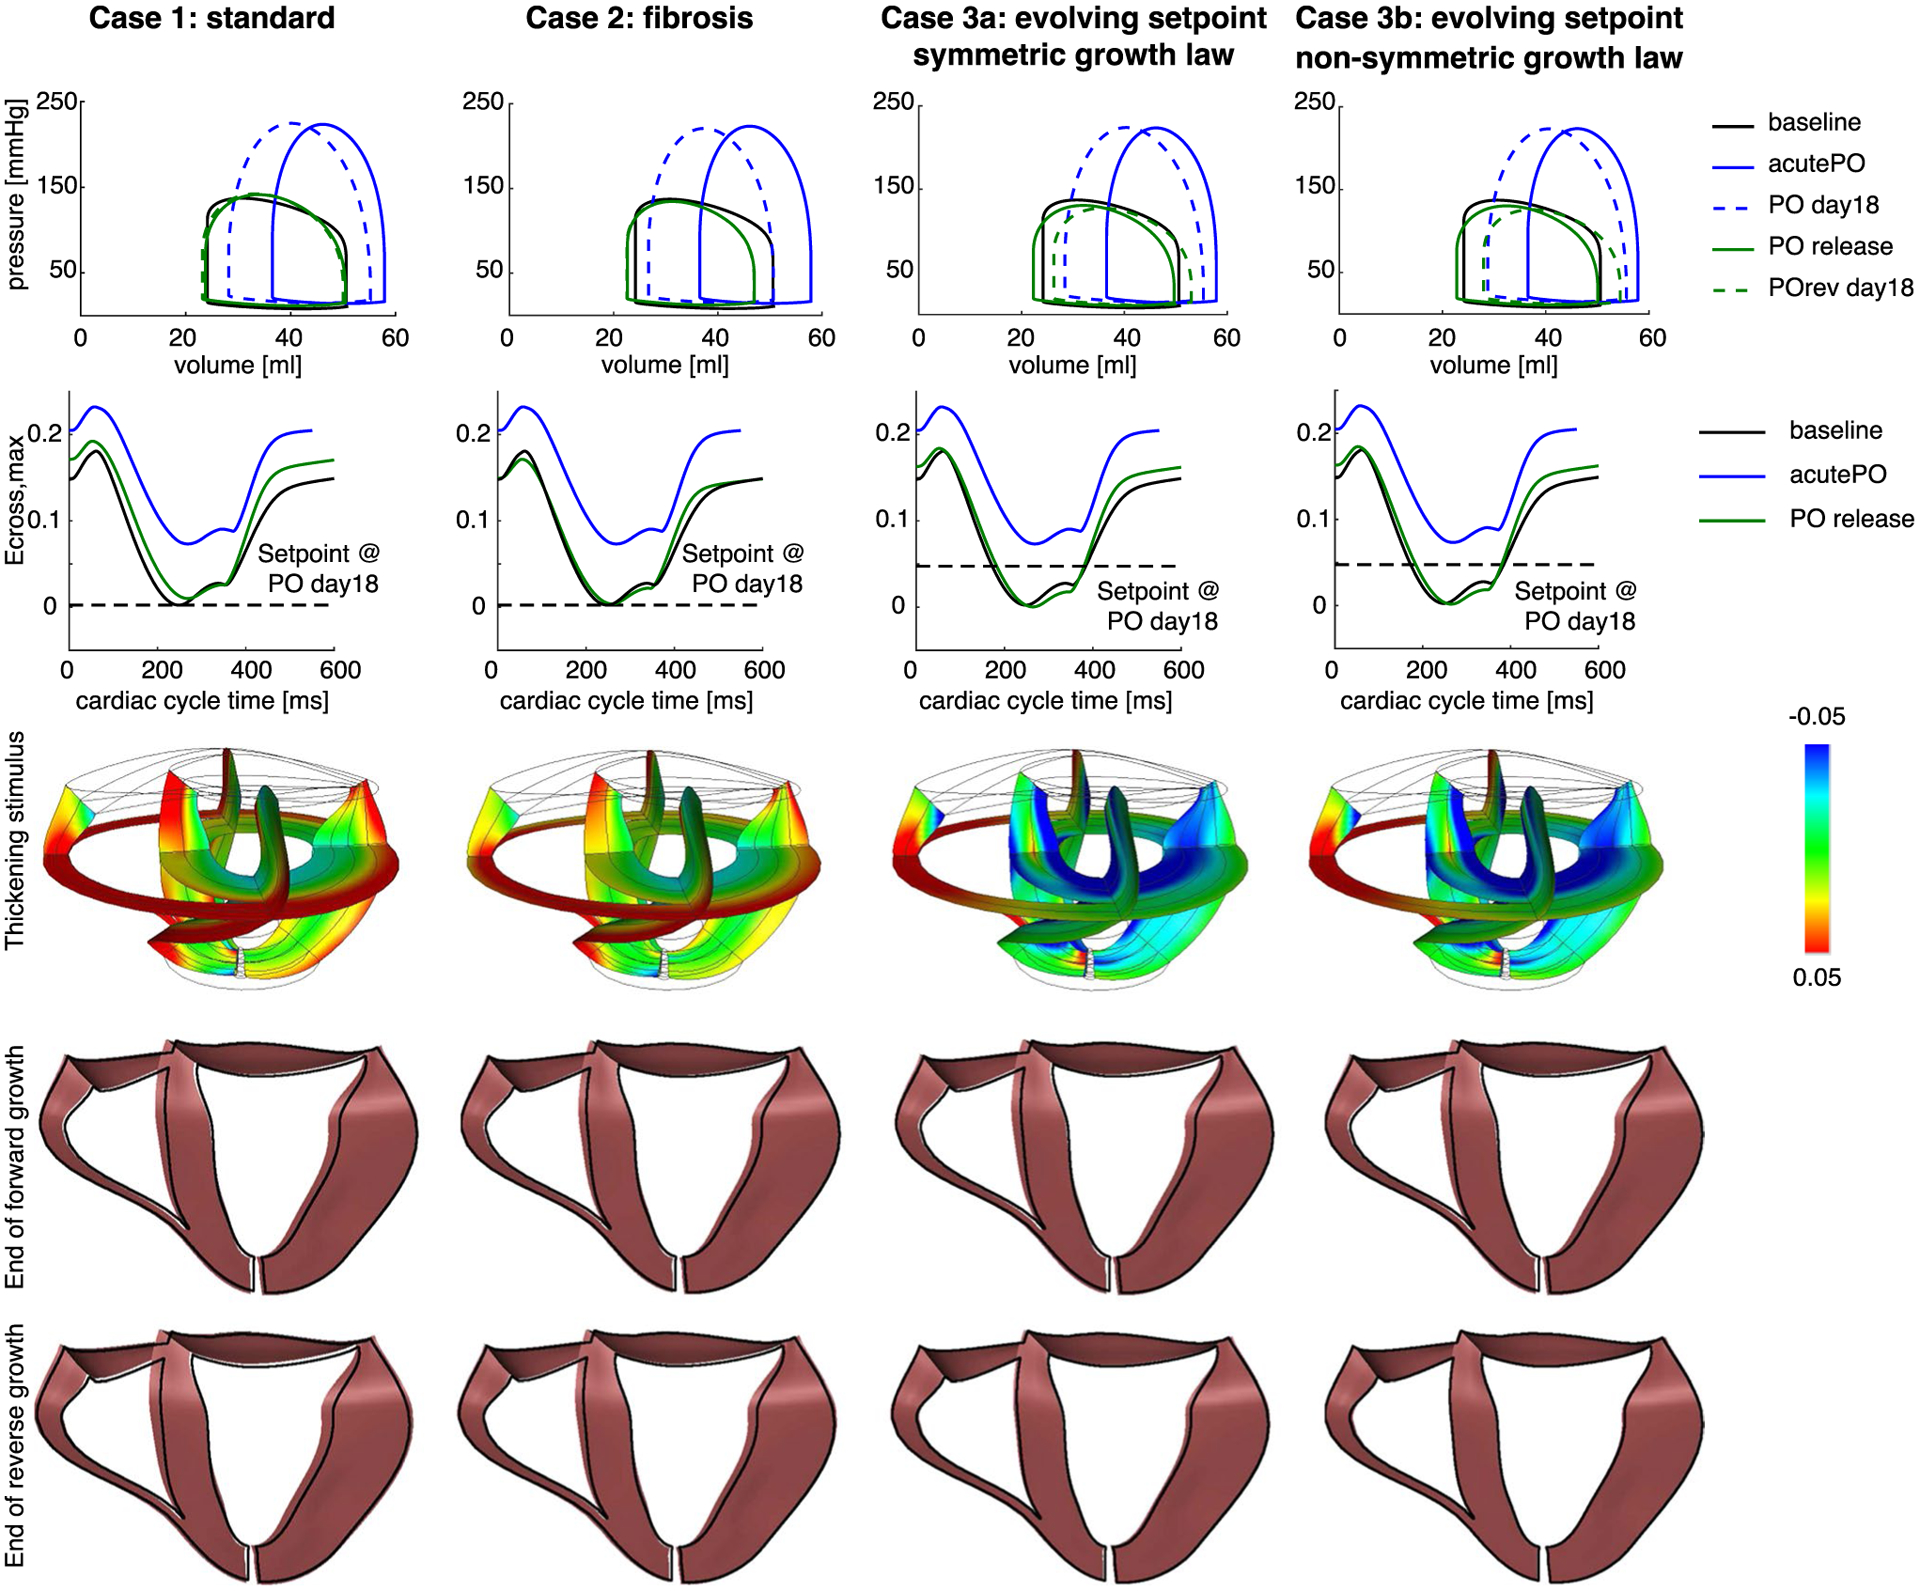
Fig. 5.

Matching PO release hemodynamics causes the elastic strains to return to baseline, triggering little-to-no regression in wall thickness. Each column represents one of the four cases simulated (see text). Top row: pressure–volume (PV) loops for baseline, acutePO, end of simulated forward growth, PO release, and end of simulated reverse growth. Second row: Ecross,max throughout the cardiac cycle for baseline, acutePO, and PO release for a midwall Gauss point on the lateral wall in the LV. Third row: contour plots of the thickening stimulus (st) immediately following PO release. Fourth row: unloaded grown geometry (colored in pink) at the end of forward growth (PO day 18) compared with the ungrown geometry (outline in black). All cases resulted in similar changes in the geometry. Bottom row: unloaded grown geometry (colored in pink) at the end of reverse growth (POrev day 18) compared with the ungrown geometry (outlined in black). Cases 1 and 2 did not lead to any changes in geometry compared with PO day 18, whereas Cases 3a and 3b resulted in a smaller heart compared to PO day 18
