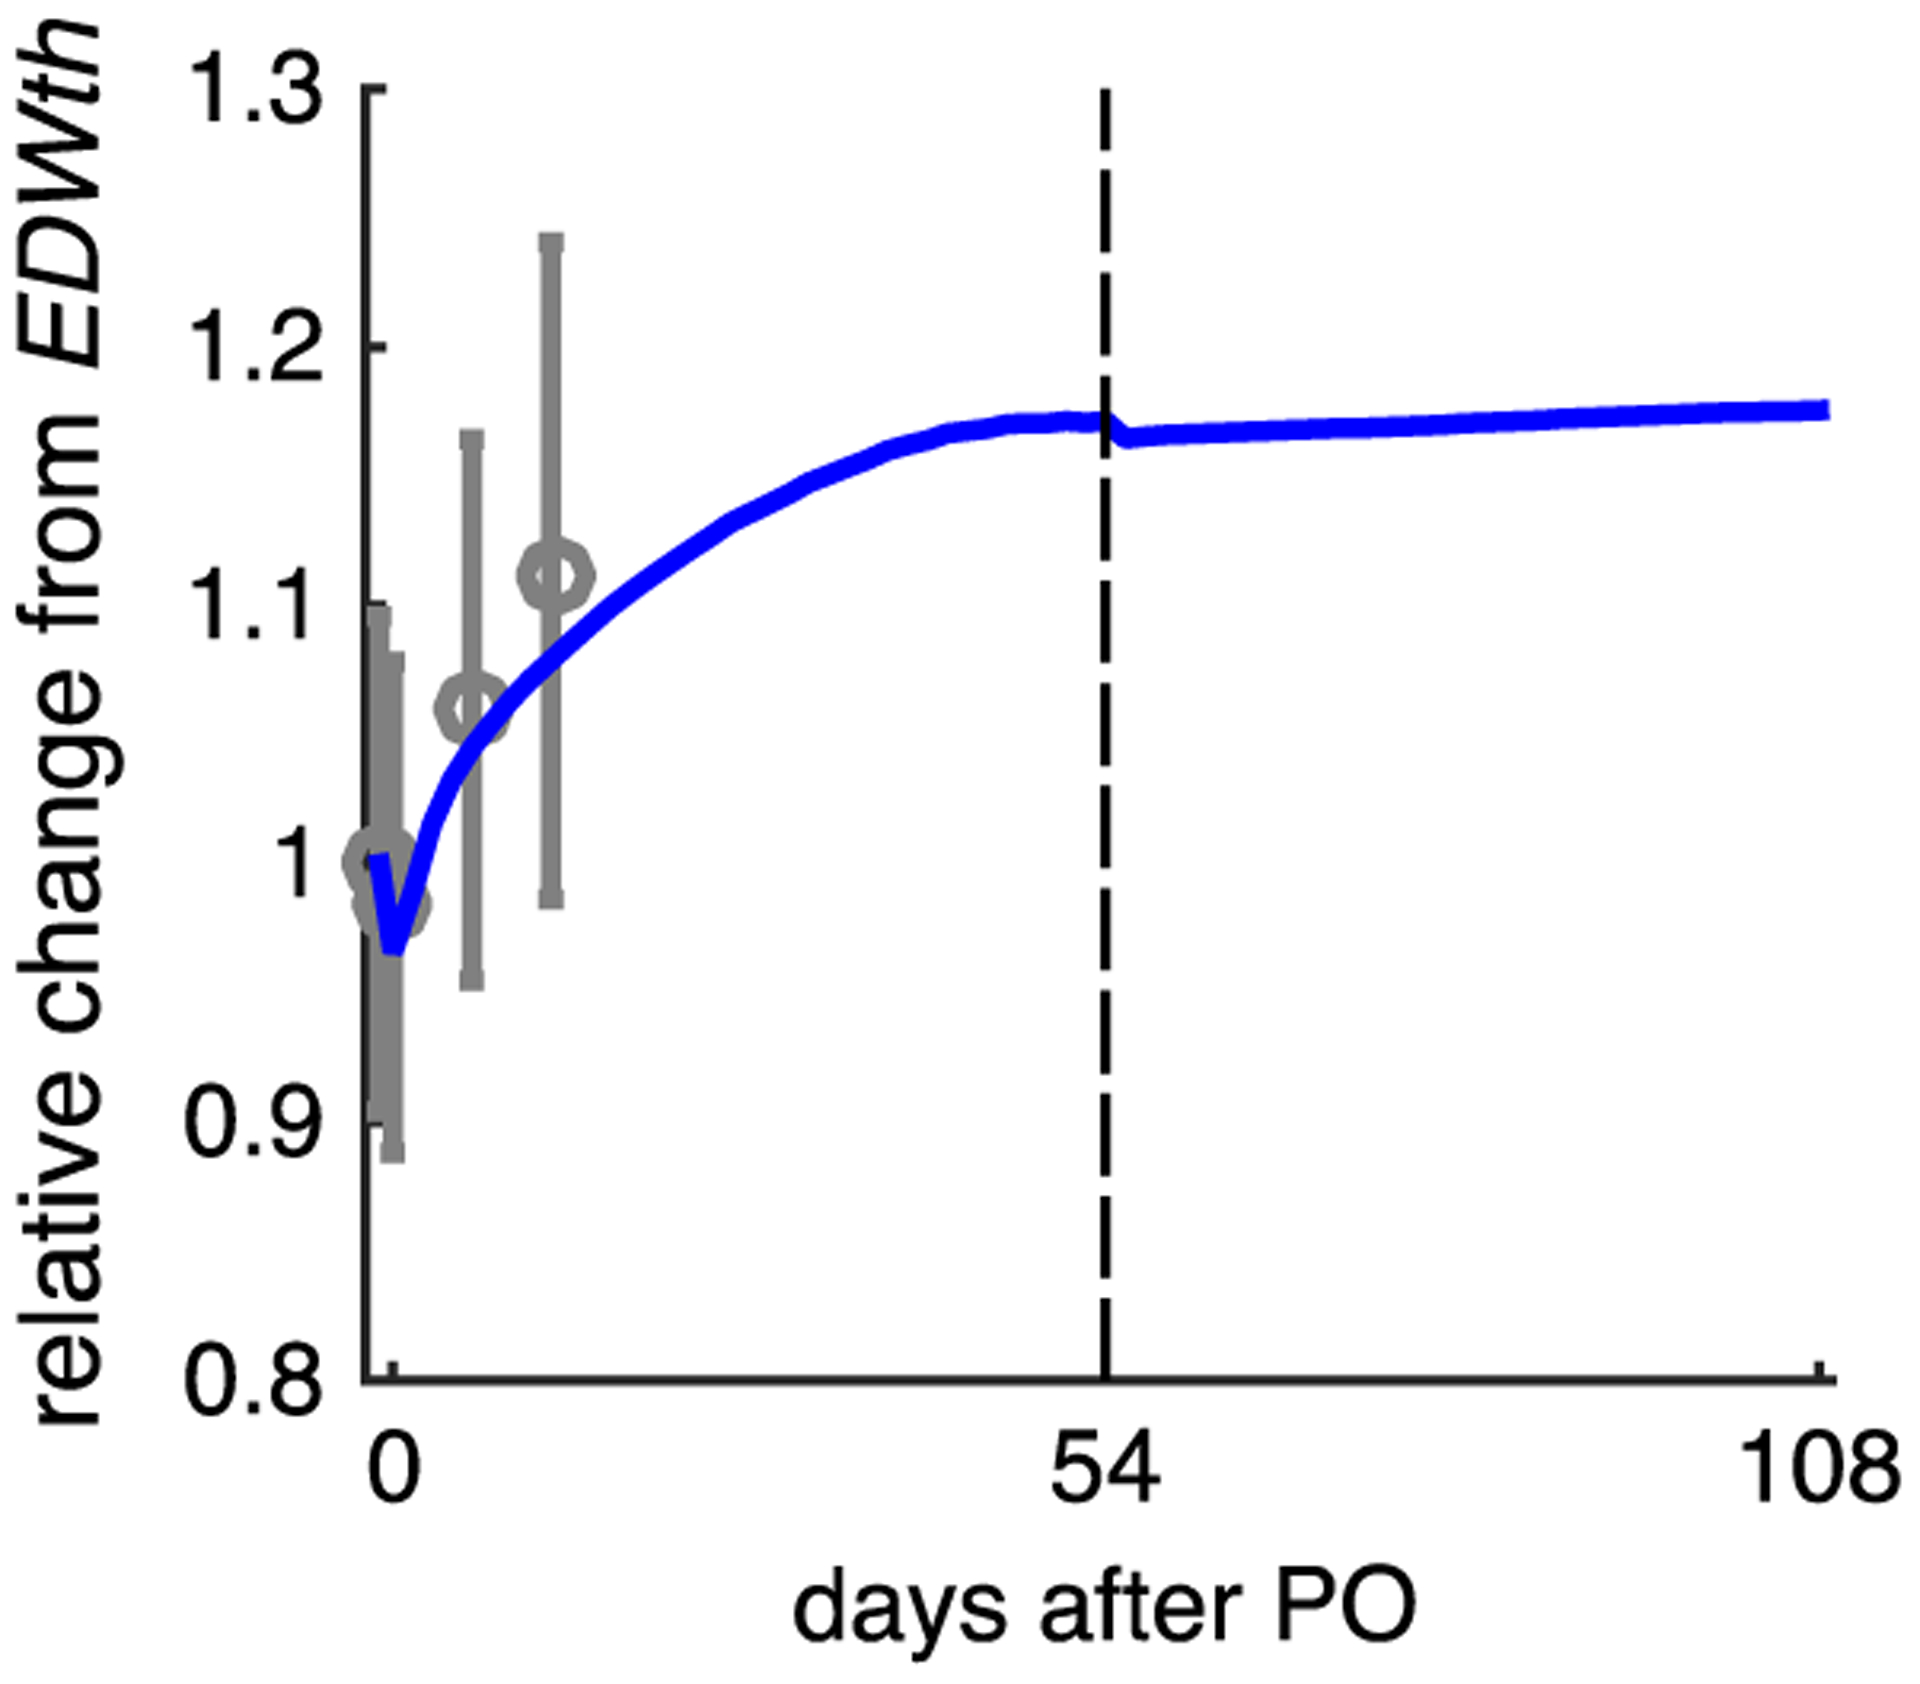
Fig. 6.

Increasing the duration and extent of forward growth due to PO does not significantly affect reverse growth predictions following simulated PO release. Solid line shows change in predicted EDWth for simulation Case 2 (fibrosis) over 54 days of forward growth followed by 54 days of continued simulation after PO release; symbols show data from Sasayama et al. (1976) during 18 days of forward growth following aortic constriction
