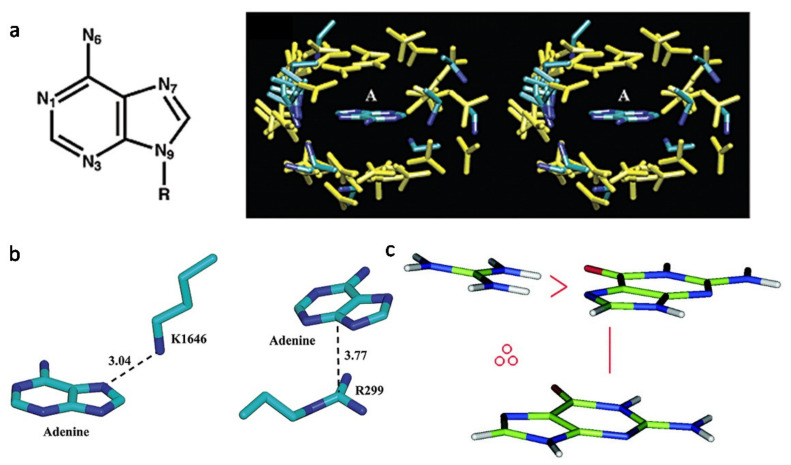
Figure 1.
The interaction forces contribute to the aptamer–protein complex formation. (a) Pattern of cation–π interactions between charged residues and adenine. (left) Molecular structure of adenine. (right) A stereo diagram of adenine surrounded by positively charged residues in 68 adenine-binding proteins [68]. (b) Representative intermolecular interactions between adenine and positively charged residues. (left) Lys···Adenine pair in the TRP Ca-channel kinase domain (PDB ID: 1IA9); (right) Arg···Adenine pair in asparagine synthetase (PDB ID: 12AS). The atom−atom distance is indicated by a dashed line and is given in angstroms [68]. (c) A color picture to illustrate the H-bond/cation–π stair interaction motif. The depicted stair motif is of type G∴Arg∨G, where the symbol ∴ means cation–π interaction and ∨ H-bond. Cation–π interactions are defined geometrically by a distance and an angle criterion [69].

