Figure 1.
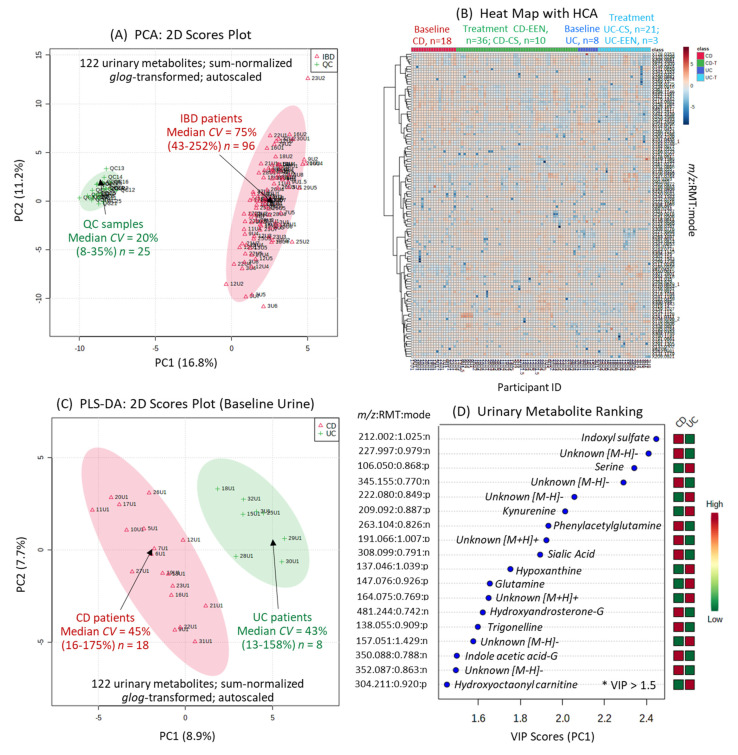
The urine metabolome of pediatric IBD patients by MSI-CE-MS prior to and following induction therapy via exclusive enteral nutrition (EEN) or corticosteroid (CS) intervention. (A) A 2D scores plot using principal component analysis (PCA) highlighting the technical precision (pooled urine as QC samples) as compared to biological variance of 122 metabolites measured consistently (CV < 35%) in most urine samples (>75%). (B) A 2D heat map with hierarchical cluster analysis (HCA) provides an overview of the data structure and study design, including baseline urine metabolic phenotypes for Crohn’s disease (CD) (n = 18) and ulcerative colitis (UC) (n = 8) patients who were mainly treated by EEN and CS induction therapy over 8 weeks, respectively. (C) Supervised multivariate data analysis of the urine metabolome from pediatric IBD patients at baseline when using partial least squares-discriminate analysis (PLS-DA) enables differentiation of CD from UC affected children based on (D) 18 top-ranked urinary metabolites having variable importance in projection (VIP) scores > 1.5. Leave-one-out cross-validation was performed on the PLS-DA model using five components.

