
Figure 5.
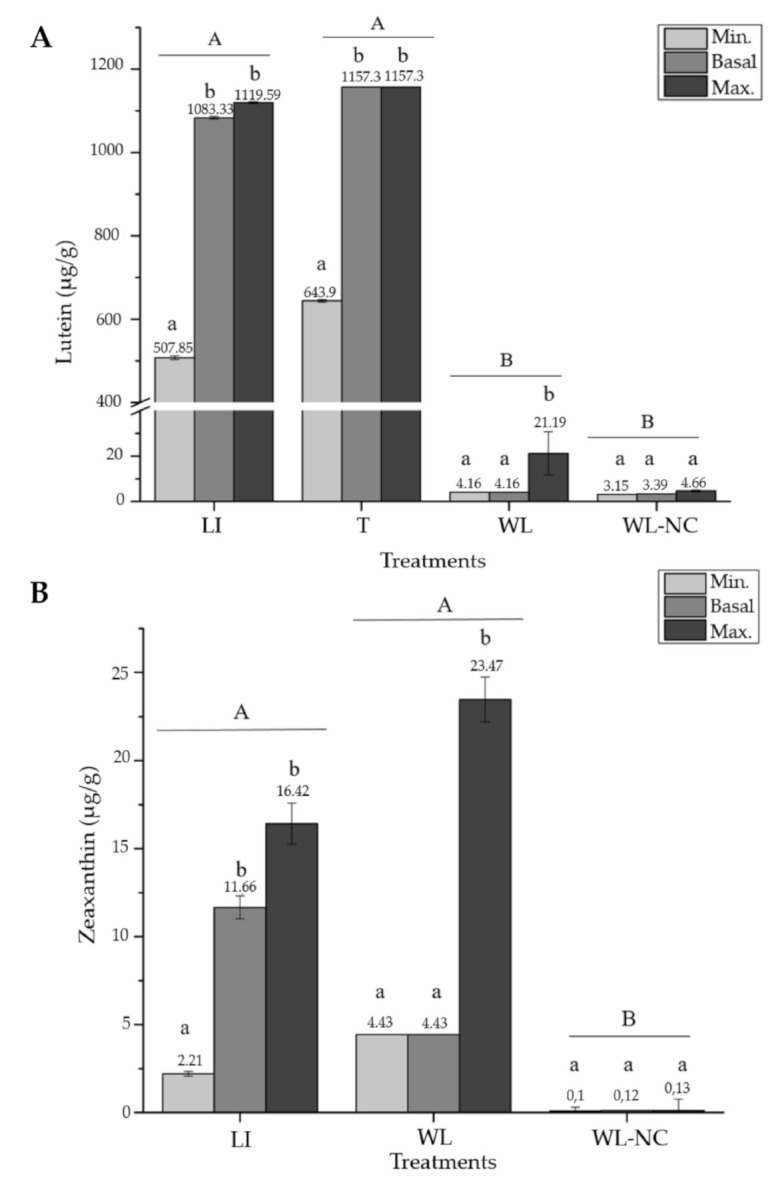
The minimum, basal, and maximum experimental content (µg/g dm) for Porphyra/Pyropia species of (A) lutein and (B) zeaxanthin. The mean ± SE of the extracted data is presented (n ≥ 3). Different capital letters above the bars indicate significant differences between treatments, and lower-case letters indicate significant differences between contents for the same treatment, with a p < 0.05 according to the GLM. Treatments: light intensity (LI), temperature (T), wavelength (WL), and wavelength and nutrient composition (WL-NC).