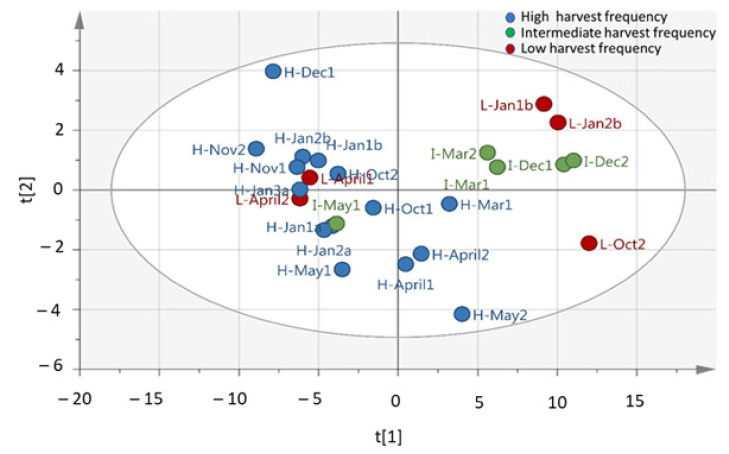
Figure 1.
Principal component analysis (PCA) analysis (PC1 and PC2) of M. oleifera (cultivar PKM1) metabolite profile under high, intermediate, and low harvesting frequencies (R2X = 0.94; Q2 = 0.844). R2X and Q2 represent the cumulative values of all the components of the model. Low harvest frequency (red dots), intermediate harvest frequency (green dots), high harvest frequency (blue dots). H-30 days harvesting frequency; I-60 days harvesting frequency; L-90 days harvesting frequency; Jan-a = January, A = April, Mar = March, May = May, Oct = October, Nov = November, Dec = December; Jan-b–January of the next year. R2X[1] = 0.78; R2X[2] = 0.058.

