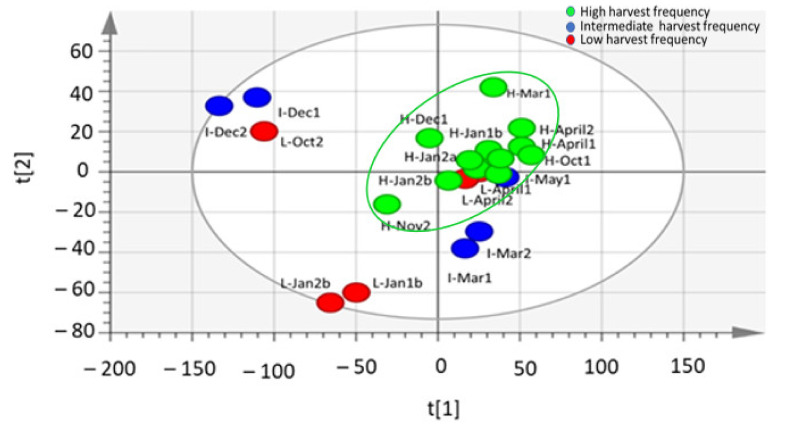
Figure 6.
Partial least square (PLS) linear regression score plot showing 1H-NMR spectral data of M. oleifera (cultivar PKM1) metabolites profile under low, intermediate, and high harvesting frequencies. Low harvest frequency (red dots), intermediate harvest frequency (blue dots), high harvest frequency (green dots). H-30 days harvesting frequency; I-60 days harvesting frequency; L-90 days harvesting frequency; Jan-a = January, A = April, Mar = March, May = May, Oct = October, Nov = November, Dec = December; Jan-b–January of the next year. R2X[1] = 0.488; R2X[2] = 0.116.

