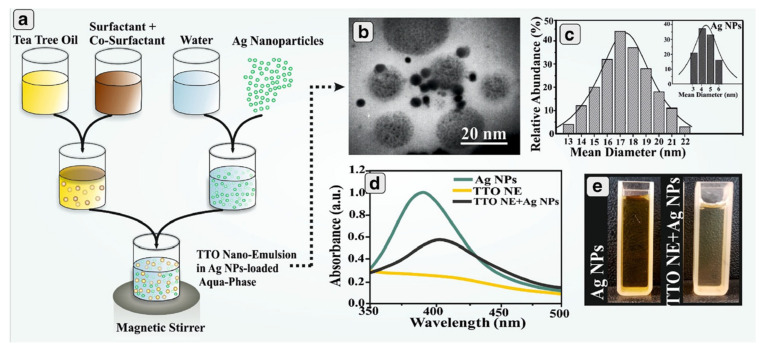
Figure 4.
Schematic illustration of preparation procedure of TTO NE + Ag NPs (a), Transmission electron micrograph and size distribution of TTO NE and Ag NPs as inset (b,c). UV–Vis spectroscopy of TTO NE + Ag NPs and Ag NPs, as well as TTO (d). Optical images of Ag NPs and TTO NE + Ag NPs (e). Reproduced with permission from [120], AAPS PharmSciTech, 2018.

