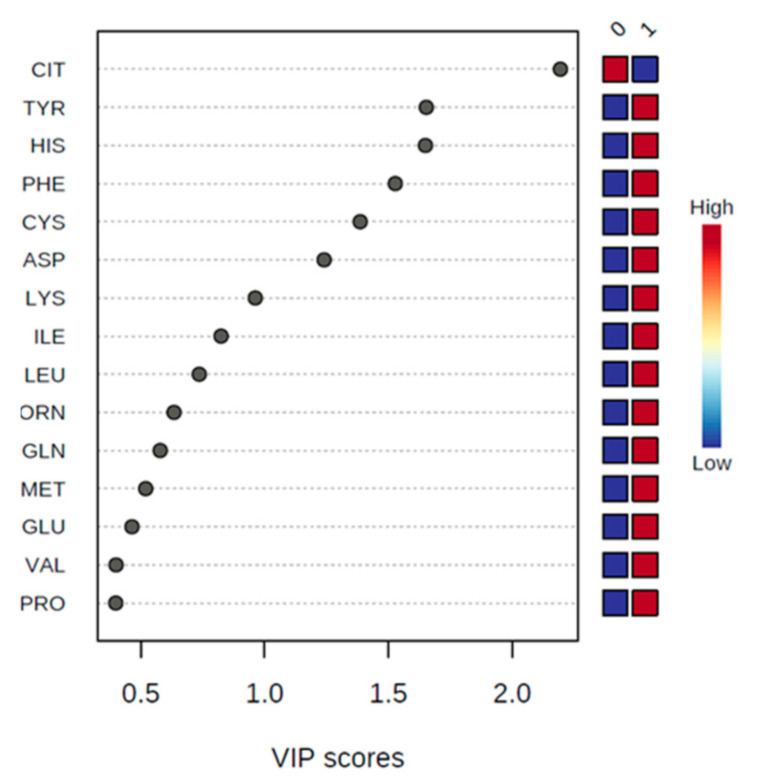
Figure 2.
Important metabolites identified by PLS-DA. The colored boxes on the right indicate the relative concentrations of the corresponding metabolite in each group under study. The lower oxidative stress (Q1–Q3 nitrotyrosine) group is referred to by 0; the highest oxidative stress (Q4 nitrotyrosine) group’s PLS-DA (partial least-squares discriminant analysis) is referred to by 1; VIP, variable importance in the projection.

