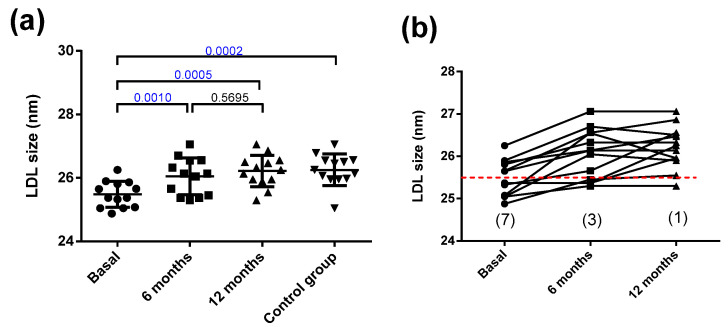
Figure 3.
LDL size. (a) LDL size determined by non-denaturing gradient gel electrophoresis. (b) Individual changes in LDL size after bariatric surgery. The dashed red line indicates 25.5 nm, the threshold between LDL subfraction phenotypes A and B, and numbers in parentheses indicate the number of patients with the atherogenic phenotype B. Data are expressed as mean ± SD. Bars indicate P. Blue values indicate statistically significant differences.

