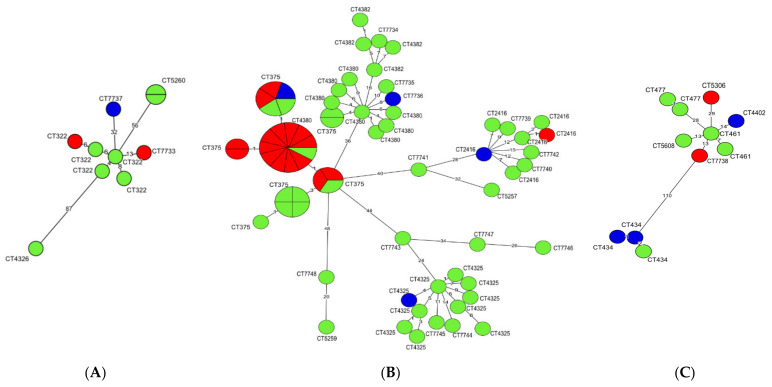
Figure 1.
Minimum spanning tree (MST) analysis based on cgMLST allelic profiles of 91 L. monocytogenes isolates. Each CC is shown on a separate MST: (A) CC1; (B) CC2; (C) CC6. The circles represent cgMLST types (CTs). The different colors indicate isolate source (green, ready-to-eat food; red, raw meat; blue, food production environments). Numbers on the branches show allele differences between neighboring nodes (CTs).

