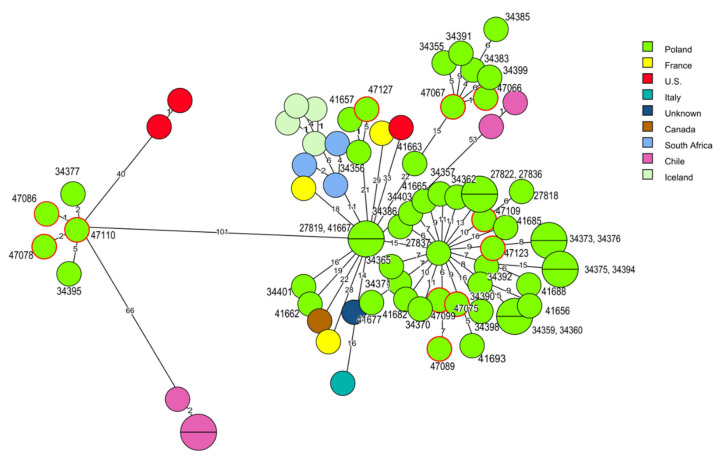
Figure 4.
Minimum spanning tree (MST) analysis based on the cgMLST profiles (CTs) of 11 L. monocytogenes CC6 strains tested in the present study together with 62 strains of CC6 at BIGSdb-Lm and the literature. cgMLST types are represented by circles with different colors related to countries of strains’ origin. Numbers on the connecting lines show allele differences between adjacent nodes (CTs). The numbers next to circles show ID of Polish L. monocytogenes strains. Circles with red rim represent isolates from the present study.

