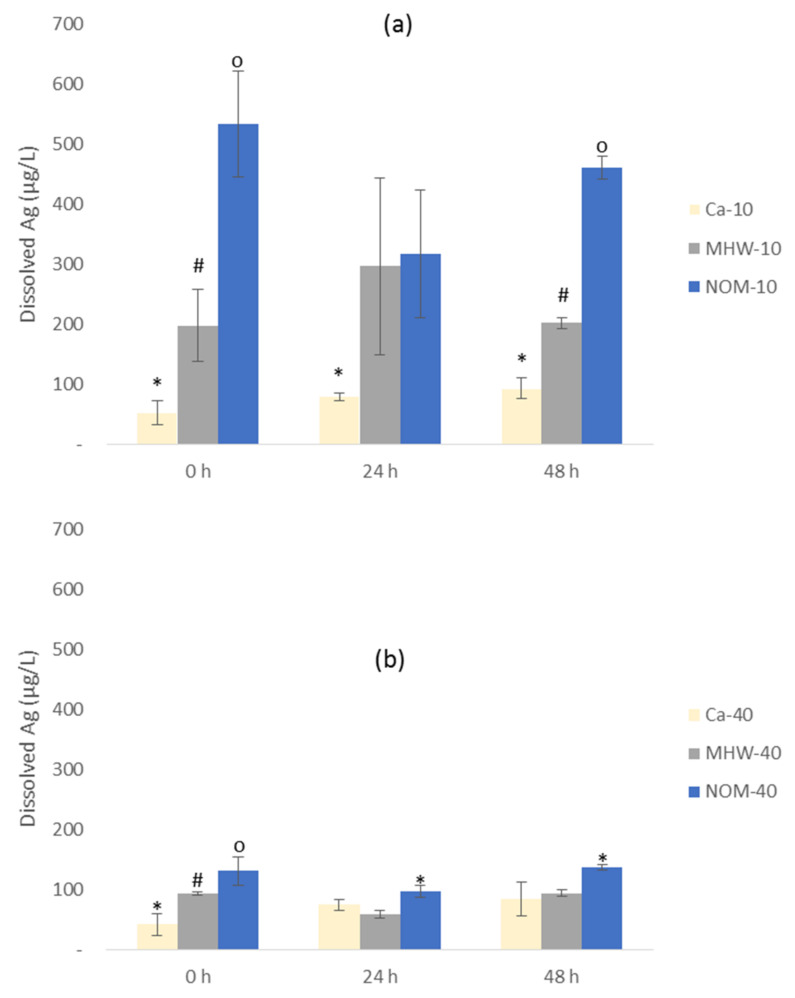
Figure 4.
Dissolution of AgNPs at 0, 24 and 48 h in MHW, NOM and Ca2+ water exposures for: (a) 10-AgNPs and (b) 40-AgNPs. Bars denote standard error (n = 3) and the symbols on top (*, #, o) represent statistical difference where similar symbols are indicative of no statistical diference whereas differing symbols indicate statistical difference between water treatments within a specific AgNPs size as tested at p < 0.05 with Turkey Kramer honest significant difference (HSD).

