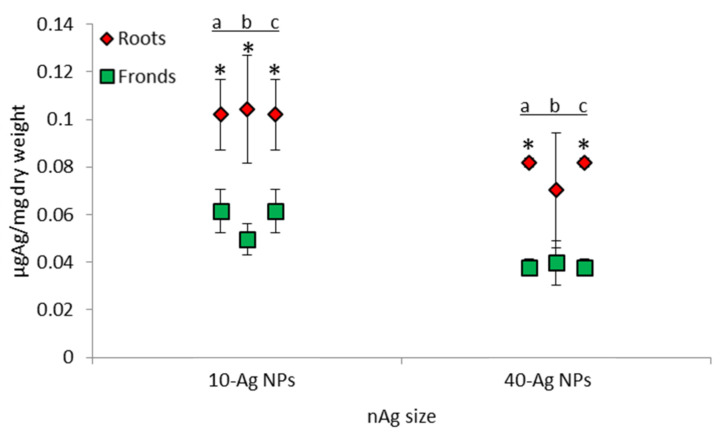
Figure 6.
Accumulation of Ag by Salvinia minima roots and fronds after 48 h for the 10- and 40-AgNPs obtained from inductively coupled plasma mass spectroscopy (ICP-MS) analysis. Bars denote standard error (n = 3) and the * indicates a statistical difference between roots and fronds Ag accumulation within a specific water type; a = MHW, b = NOM, and c = Ca2+. Student’s t-test, p < 0.05: MHW (10-AgNPs = 0.022, 40-AgNPs = 0.0003), NOM (10-AgNPs = 0.043, 40-AgNPs = 0.147), Ca2+ (10-AgNPs = 0.039, 40-AgNPs = 0.0001).

