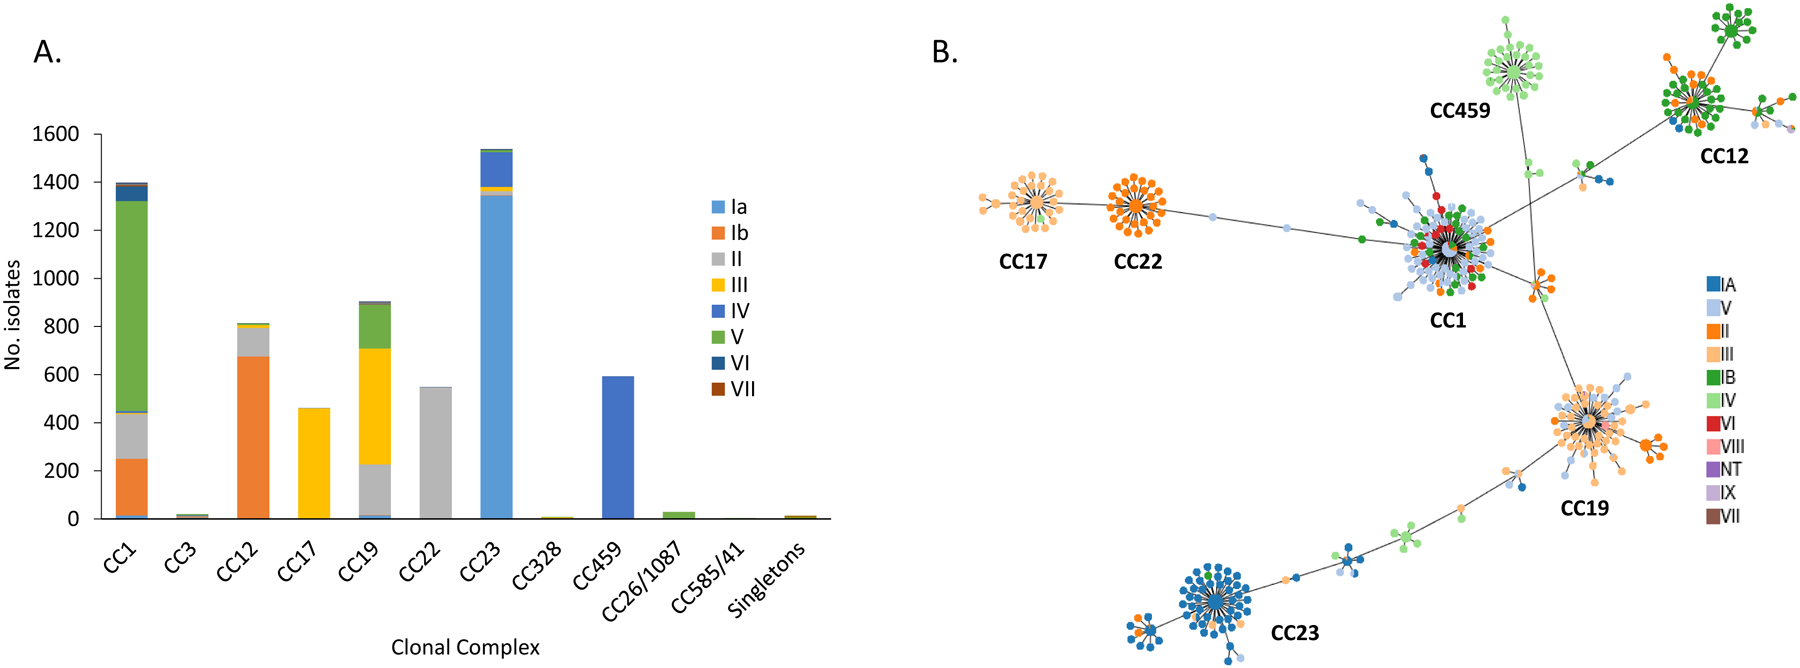
Figure 2.

A. Serotype associations within individual clonal complexes. B. Phyloviz diagram depicting individual MLST and associations with the 10 different serotypes.
(Note: In the minimum spanning tree, each ST is displayed as a circle and serotypes are represented by different colors. The size of circles are all the same and do not represent the prevalence of each ST. Major clonal complexes (CCs) are indicated)
