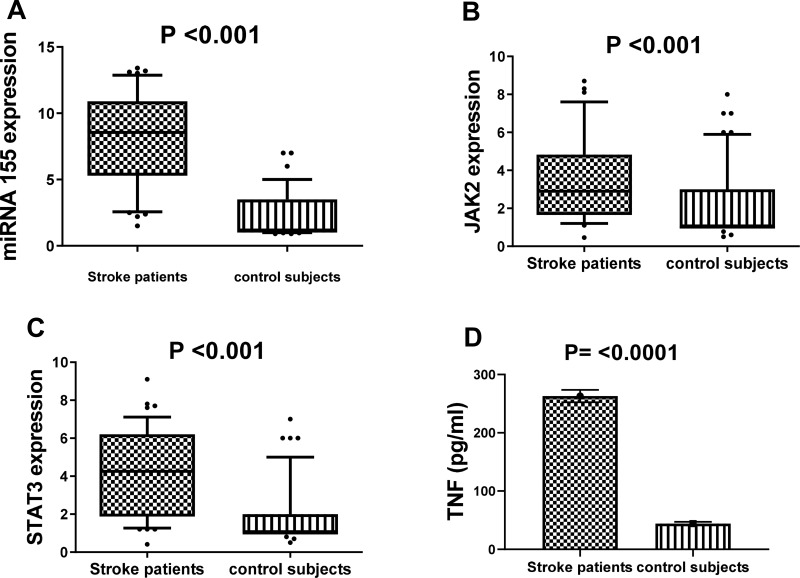
Figure 1.
The relative expression level of miR-155 (A), JAK2 (B) and STAT3 (C), as well as the level of TNF concentration (D) among stroke patients and healthy controls.
Notes: Horizontal lines inside the box plots represent the median, the boxes mark the interval between the 25th and 75th percentiles; the whiskers denote the intervals between the 10th and 90th percentiles. Filled circles indicate data points outside the 10th and 90th percentiles; statistical differences were analyzed using Mann–Whitney test; data are presented as mean ± standard error, significant difference at P<0.05.

