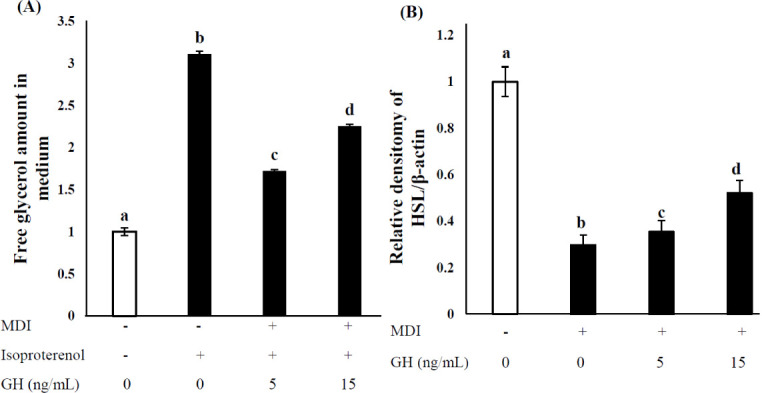
Fig. 4. Effect of GH on lipolysis and HSL expression in 2-wk differentiated SVCs.

Untreated cells (0 ng/ mL GH, no MDI) were used as negative controls, and MDI- and isoproterenol-treated cells (no GH) were used as positive controls. The MDI mixture comprised 1 μM DEX, 0.5 mM IBMX, and 10 μg/mL INS. (A) The extent of lipolysis was expressed relative to the amount of free glycerol in the medium. (B) HSL mRNA expression was calculated via real-time PCR using SYBR green and expressed relative to that of β-actin. Values are expressed relative to those in negative control considering as 1.00. Values represent the means ± SD (n = 3). Superscripts indicate statistically significant differences (p < 0.05). MDI, methylene diphenyl diisocyanate; GH, growth hormone; HSL, hormone-sensitive lipase; SVCs, stromal vascular cells; DEX, dexamethasone; IBMX, isobutylmethylxanthine; INS, insulin; PCR, polymerase chain reaction.
