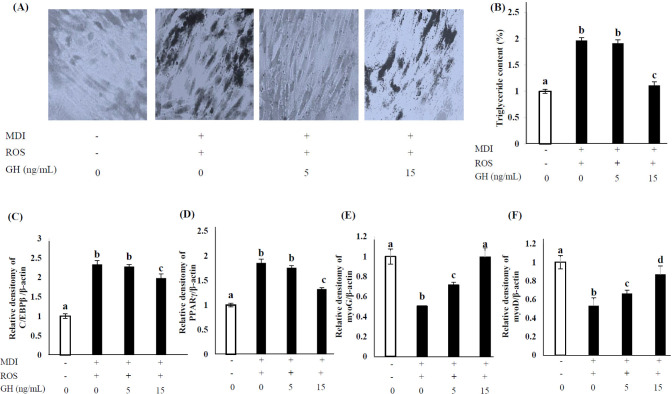
Fig. 5. Effect of GH on TG accumulation, morphological changes, and adipogenic and myogenic gene expression in C2C12 myoblasts after 1-wk adipogenic differentiation with ROS.
Untreated cells (0 ng/mL GH, no MDI) were used as negative controls, and MDI-only-treated cells were used as positive controls. The MDI mixture comprised 1 µM DEX, 0.5 mM IBMX, and 10 µg/mL INS. (A) Differentiated cells were stained with Oil Red O, counterstained with crystal violet, and visualized under a microscope. (B) Oil Red O stain was extracted and quantified to measure TG accumulation. (C, D) The expression of adipogenic genes (C/EBPβ and PPARγ) and (E, F) myogenic genes (myoG and myoD) was calculated via real-time PCR using SYBR green and expressed relative to that of β-actin. Values are expressed relative to those in negative control considering as 1.00. Values represent the means ± SD (n = 3). Superscripts indicate statistically significant differences (p < 0.05). MDI, methylene diphenyl diisocyanate; ROS, reactive oxygen species; GH, growth hormone; TG, triglyceride; DEX, dexamethasone; IBMX, isobutylmethylxanthine; INS, insulin; C/EBP, CCAAT-enhancer-binding protein; PPAR, peroxisome proliferator-activated receptor; myo, myogenin; PCR, polymerase chain reaction.

