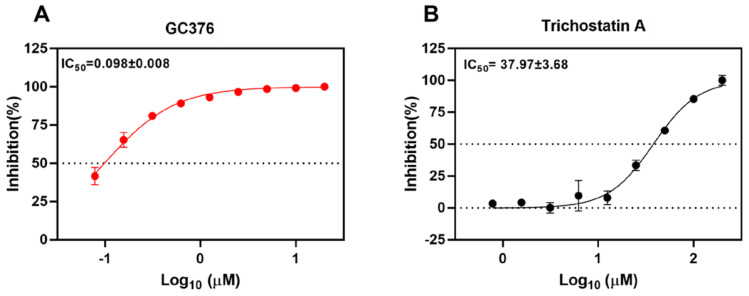
Figure 2.
Inhibition of the cleavage activity of SARS-CoV-2 Mpro by trichostatin A. Titration of the protease activity of SARS-CoV-2 Mpro by (A) GC376 (positive control) and (B) trichostatin A at various concentrations as indicated by a fluorescence resonance energy transfer-based assay. The data were expressed as a percentage of the control reaction in the absence of inhibitors. Dose-response curves for half maximal inhibitory concentration (IC50) values were determined by nonlinear regression. The mean value of three replicates was shown and error bars indicated ±SD of n=3 independent replicates. All the experiments were repeated twice for confirmation.

