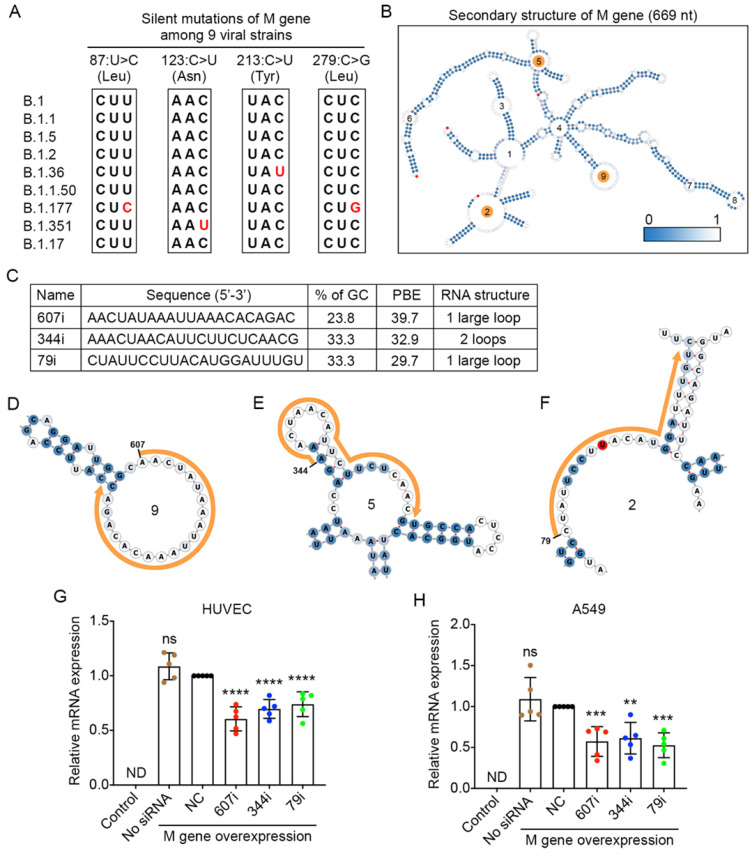
Figure 5.
Selection of high PBE siRNAs for the membrane (M) gene. A. Mutation information of the M gene among the nine viral strains. B. The secondary structure of the RNA molecule of the M gene where the mutated sites are labeled in red. The loops numbered 2, 5 and 9 are highlighted in orange, as these regions were selected for siRNA targeting. C. The sequence, GC content, PBE and RNA structure of the three selected siRNAs. D-F. Detailed structures of targeted regions by three siRNAs, 607i (D), 344i (E) and 79i (F), on the M gene with the siRNA sequences outlined in orange. G-H. Real-time qPCR was used to measure the relative expression of the M gene in both HUVECs (G) and A549 cells (H) after transfection with the plasmid DNA of the M gene and individual siRNAs at 24 hours. Cells that were not transfected were used as a background control. All values were normalized to the siNC group in which cells were transfected with the M gene and a negative control siRNA simultaneously.

