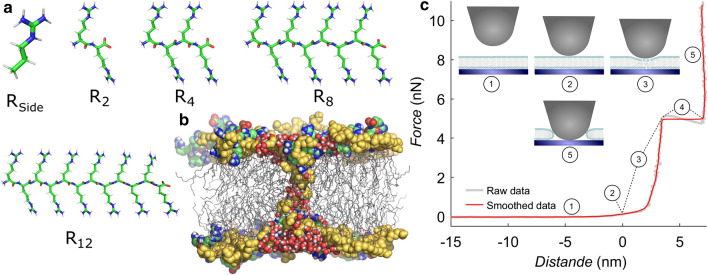
Fig. 1.
a Stick representation of an arginine side chain mimic R and oligo-arginines R, R, R and R. b Simulation snapshot of a POPG membrane with an open pore. Lipid headgroups are represented as yellow spheres, tails as grey sticks. For clarity, only water molecules near the pore are shown as red/white spheres. Arginine-8 is shown as colored green/blue/white/red spheres. c Exemplary force vs. distance curve with a breakthrough event, as collected on the atomic force microscope, with illustrations of the cantilever tip and membrane. (1) As the cantilever approaches, its deflection is initially zero. The contact point (2) is usually defined as the point from which cantilever deflection starts increasing. The cantilever tip deforms the bilayer as it exerts more force (3), until at some point it breaks through with a discrete event with two kinks (4). After breakthrough, the cantilever is in contact with the solid support (5). The force at which the breakthrough event occurs is defined as ’yield force’, in our case the average force of plateau (4)

