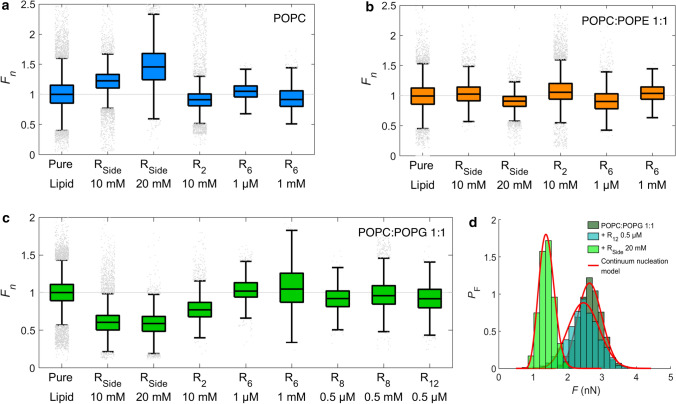
Fig. 3.
Boxplots of normalized yield forces of membranes varying in composition after incubation with different R-derivatives. Normalization was performed for the median of the yield force obtained in the absence of R-derivatives for each experiment. Each boxplot contains combined data from at least two independent experiments. The bottom and top edge of the boxplots indicate the 25th and 75th percentile of each data set, and the line dividing the box indicates the median. The upper and lower whisker represent approximately 2.7 standard deviations higher or lower than the mean, respectively. Outliers (points beyond 2.7 standard deviations from the mean) are shown as grey points. a POPC; b POPC:POPE 1:1; c POPC:POPG 1:1. d Normalized histograms of yield force results of POPC:POPG 1:1 and a combination with and , respectively, all probed with the identical cantilever. The probability density function of each data histogram was fitted (red lines) to a continuum nucleation model as introduced by Loi et al. (Loi et al. 2002), to obtain line tension and spreading pressure S

