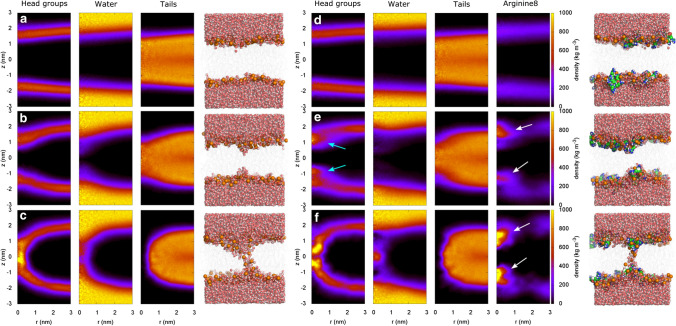
Fig. 8.
Pore formation during MD simulations over membranes of (a–c) pure POPG and (d–f) of POPG plus eight R. The columns in shaded colors show the mass density of (from left to right) headgroups, water, tails, and R, as averaged over umbrella sampling windows restrained at (A/D) , (B/E) , and , corresponding states with a flat membrane, a partial defect, and a fully formed pore, respectively. Densities are plotted as function of lateral distance r and vertical distance z from the center of the defect. Evidently, R accumulates at the partial and fully formed defect (white arrows), where R replaces water and stabilizes lipid headgroups (cyan arrows)

