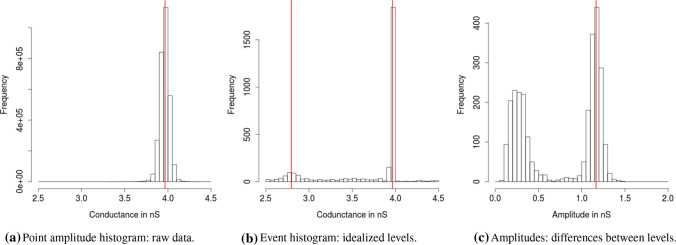
Fig. 13.
Histograms of the PorB measurement with ampicillin in Fig. 1. Histograms are based on the visualized and on ten additional traces. Code to obtain such histograms was explained in the paragraph ’Interpreting, plotting and verification of the output’ in Using our software. In the point amplitude histogram, we found one dominant conductance level of 3.9664 nS (estimated by the half sample mode). Smaller conductance levels are not visual, since they are too short and smoothed by the low-pass filter (in total, 2,476 data points are between 2.5 nS and 3.5 nS). The event histogram confirms this conductance level. Note that the peak is much narrower in the event than in the point amplitude histogram. This is usually the case and improves identification of conductance levels. Moreover, because of the deconvolution step in our idealization and since dwell times are not represented in the event histogram, we were also able to identify a second conductance level of 2.7956 nS, i.e., the amplitude (difference, blockage effect of the ampicillin) is 1.1708 nS. The amplitude histogram confirms this finding with a pronounced mode at 1.1662 nS. A simple mean is roughly the same with 1.1546 nS. The amplitude histogram but also the event histogram shows further events. Those events could be matched to processes unrelated to the interaction of ProB and ampicillin, and hence should be ignored for the ampicillin influence, confer (Bartsch et al. 2019)

