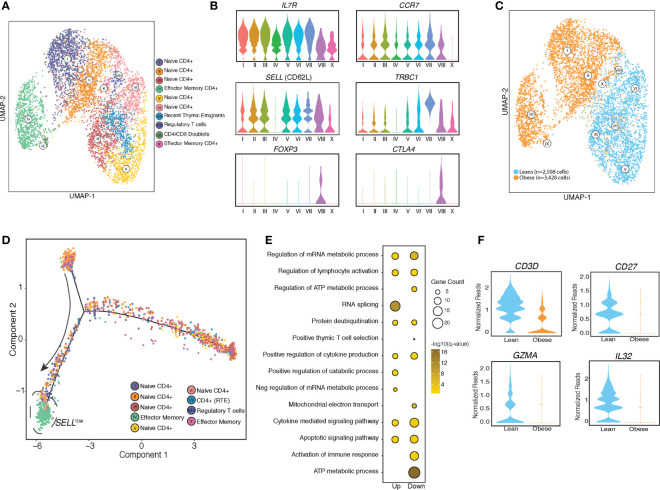
Figure 2.
UCB CD4 T cells from babies born to mothers have distinct resting transcriptional profiles. (A) UMAP visualization of CD4 T cells clusters from UCBMC single cell profiles of babies born to lean (n=2) and mothers with obesity (n=2) colored by cell state. (B) Violin plots of canonical T cell markers associated with naïve T cells, activated T cells, recent thymic emigrants (RTE) and regulatory T cells. (C) UMAP visualization of CD4 T cell clusters colored by phenotype – leans colored in blue and obese in orange. (D) Trajectory analysis of CD4 T cells, colored by clustered and ordered by pseudotime based on differentially expressed genes identified by monocle. (E) Bubble plot representing gene ontology terms enriched from differentially expressed genes (DEG) identified in naïve T cell clusters in obese group relative to the lean group. Size of the bubble represents the number of genes mapping to the term while color indicates level of significance. (F) Violin plot showing normalized expression levels of genes downregulated in naïve cord blood CD4+ T cells with maternal obesity.

