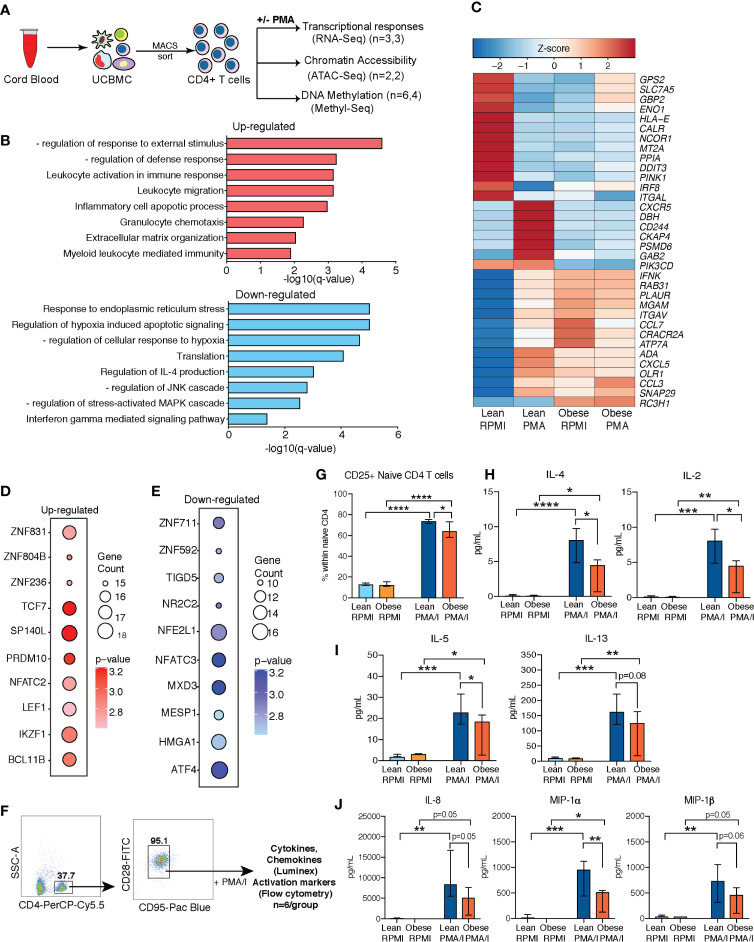
Figure 3.
Cell intrinsic defects in cord blood CD4 T cells with maternal obesity. (A) Experimental design for testing impact of maternal pregravid obesity on cord blood CD4+ T cells. CD4 T cells were magnetically isolated from UCBMC using MACS and subjected to ATAC-Seq, and MethylSeq (number of samples/group indicated in legend). Purified CD4 T cells were also stimulated with PMA/Ionomycin overnight or left unstimulated. Response was assessed using bulk RNA sequencing. (B) Bar graphs of functional enrichment of upregulated (top) and downregulated (bottom) DEG in UCB CD4+ T cells from the lean group following PMA/Ionomycin identified by Metascape. (C) Heatmap of representative DEGs detected in UCB CD4 T cells from the lean group that enriched to GO terms “leukocyte activation” and “leukocyte migration”, and “response to ER stress”. (D, E) Bubble plots representing TFs regulating (D) upregulated (left) and (E) downregulated (right) DEG in lean group following PMA stimulation. Size of the bubble represents number of genes and intensity of color represents statistical significance. (F) Gating strategy for FACS sorting naïve CD4 T cells from UCBMC. Sorted cells were stimulated with PMA/Ionomycin overnight. Secreted proteins were measured using luminex and T cell activation measured using flow cytometry (n=6/group). (G) Relative proportions of naïve CD4 T cells expressing T cell activation marker CD25. (H–J) Secreted levels of (H) IL-4 and IL-2; (I) IL-5 and IL-13), and (J) chemokines IL-8, MIP-1α, and MIP-1β following overnight PMA/I stimulation of naïve CD4 T cells from umbilical cord. Error bars represent median with interquartile ranges. (Ordinary one-way ANOVA p-values: * - p < 0.05; ** - p < 0.01; *** - p < 0.001; **** - p < 0.0001).

