Figure 2.
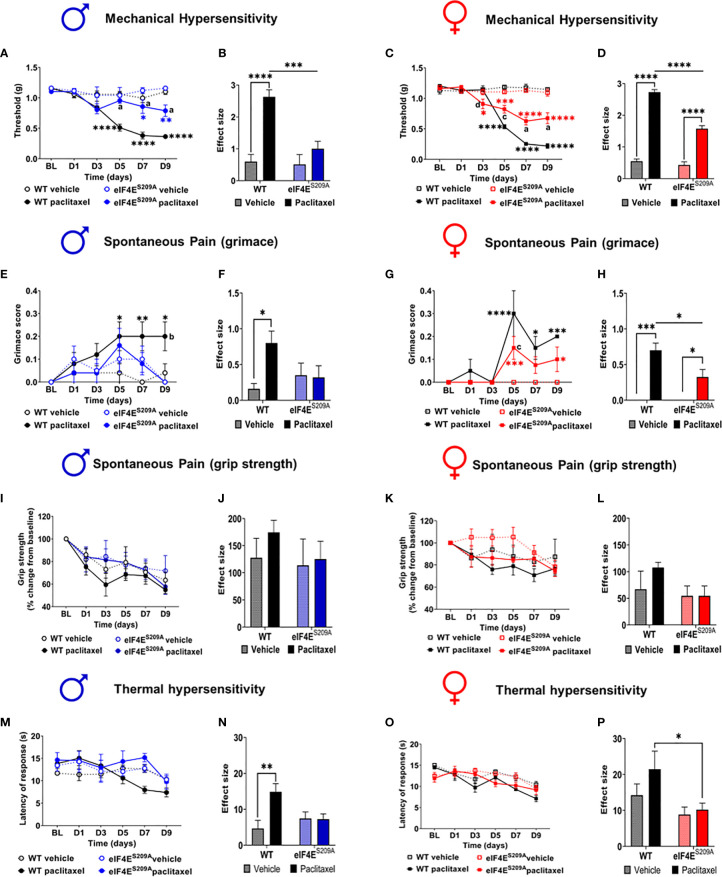
Paclitaxel induces pain like behavior in male and female mice, which is eIF4E dependent. (A) Mechanical hypersensitivity in male WT and eIF4ES209A mice. Blue asterisks *p 0.0475, ** p 0.0014 for eIF4E vehicle VS paclitaxel, Black asterisks ****p<0.0001 for WT vehicle VS paclitaxel, a=p<0.0001 for WT paclitaxel VS eIF4E paclitaxel. (B) Effect size here is determined by calculating the cumulative difference between the value for each time point and the baseline value. Data for male mice shown as effect size, ****p<0.0001, ***p 0.0004. (C) Mechanical hypersensitivity in female WT and eIF4ES209A mice. Red asterisks *p 0.0261 , ***p 0.003 for eIF4E vehicle VS paclitaxel, Black asterisks ****p<0.0001 for WT vehicle VS paclitaxel, a=p<0.0001, c=p 0.0029, d=p 0.0286 for WT paclitaxel VS eIF4E paclitaxel. (D) Data for female mice shown as effect size, ****p<0.0001. (E) Spontaneous pain assessment by grimace score in male mice. *p 0.0495, **p 0.008 for WT vehicle VS paclitaxel. (F) Grimace scores shown as effect size for male mice, *p 0.0302. (G) Grimace scores for female mice. *p 0.0153 for D7 WT vehicle VS paclitaxel, 0.0328 for D9 for eIF4E vehicle VS paclitaxel, ***p 0.0004 for D5 for eIF4E vehicle VS paclitaxel, 0.0009 for D9 for WT vehicle VS paclitaxel, ****p<0.0001 for WT vehicle VS paclitaxel. (H) Grimace scores shown as effect size for female mice, *p 0.0249 compared for treatment, *p 0.0293 compared for genotype, ***p 0.0005. (I) Grip strength for male mice. (J) Grip strength for males shown as effect size. (K) Grip strength for female mice. (L) Grip strength in females shown as effect size. (M) Thermal hypersensitivity in male mice. (N) Thermal hypersensitivity in males shown as effect size. **p 0.0072. (O) Thermal hypersensitivity in female mice. (P) Thermal hypersensitivity in females shown as effect size, *p 0.0453. All data are presented as mean ± standard error of the mean, males: n = 6 mice per group; females: n = 12 mice per group. Two-way ANOVA was performed with Tukey’s post-hoc for multiple comparisons. For all line graphs, asterisks indicate significant differences between vehicle VS paclitaxel-treated for each genotype at indicated time points. “a” (p < 0.0001), “b” (p < 0.001), “c” (p < 0.01), and “d” (p < 0.05) depict significant difference between paclitaxel-treated WT and eIF4ES209A mice at indicated time points.

