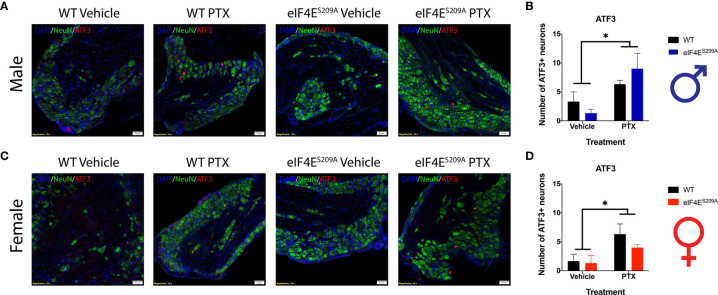
Figure 6.
ATF3+ neurons are observed in DRG of all animals subjected to Paclitaxel. (A, B) Representative composite images showing ATF3+ cells (red) and NeuN+ cells (green) for male mice and their quantitation, respectively. *p 0.0114 for males’ vehicle vs paclitaxel groups. (C, D) Representative composite images showing ATF3+ cells (red) and NeuN+ cells (green) for female mice and their quantitation, respectively. *p 0.0218 for females for vehicle vs paclitaxel groups. All sections were counterstained with DAPI (blue). Data represented as mean and SEM. Two-way ANOVA was performed with Sidak’s post-hoc for multiple comparisons; n=3 for all groups. Magnification 20X, scale bar 50µm. PTX – paclitaxel.

