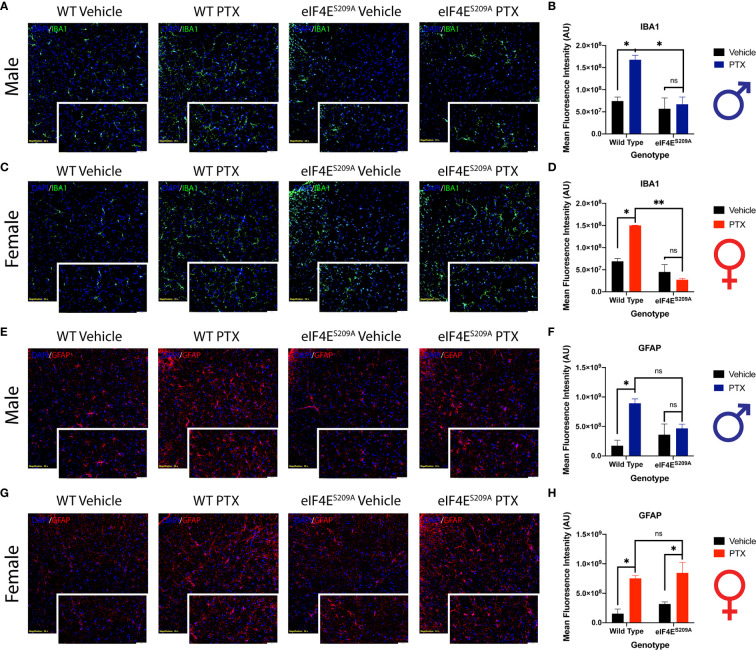
Figure 7.
Spinal glia reactivity is altered in a sex-dependent manner with paclitaxel treatment. (A) Immunohistochemistry for male microglia on lumbar spinal cord. Blue represents DAPI for cell nuclei, green represents Iba1 for microglia. Magnification 20X, scale bar 50µm. (B) Quantification of Iba1 fluorescence intensity from male mice, *p 0.022 for WT vehicle vs WT paclitaxel groups, *p 0.014 for WT paclitaxel vs eIF4ES209A paclitaxel groups. (C) Immunohistochemistry for female microglia on lumbar spinal cord. Blue represents DAPI for cell nuclei, green represents Iba1 for microglia. Magnification 20X, scale bar 50µm. (D) Quantification of Iba1 fluorescence intensity from female mice, *p 0.0153, **p 0.0029. (E) Immunohistochemistry for male astrocytes on lumbar spinal cord. Blue represents DAPI for cell nuclei, red represents GFAP for astrocytes. Magnification 20X, scale bar 50µm. (F) Quantification of GFAP fluorescence intensity from male mice, *p 0.0133. (G) Immunohistochemistry for female astrocytes on lumbar spinal cord. Blue represents DAPI for cell nuclei, red represents GFAP for astrocytes. Magnification 20X, scale bar 50µm. (H) Quantification of GFAP fluorescence intensity from female mice, *p 0.018 for WT vehicle vs WT paclitaxel groups, *p 0.0329 for eIF4ES209A vehicle vs eIF4ES209A paclitaxel groups. Data are presented as mean ± standard error of the mean, males: n = 3 mice per group; females n = 3 mice per group. Two-way ANOVA was performed with Bonferroni’s post-hoc for multiple comparisons. ns, not significant.

