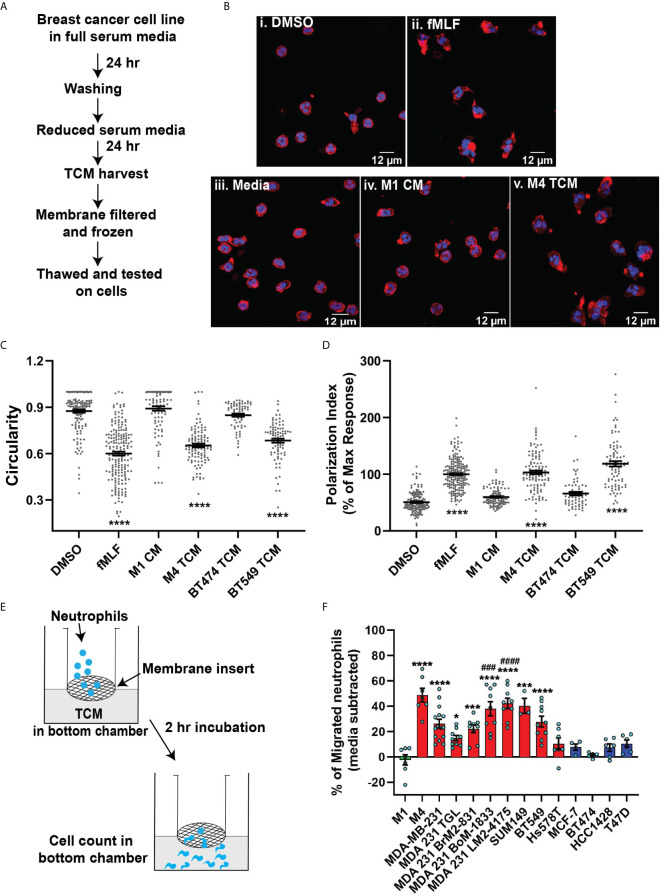
Figure 1.
TCM derived from TNBC cell lines induce neutrophil migration. (A) Flowchart describing how TCM was generated and harvested from cell lines grown under serum reduced conditions. (B) Representative maximum intensity projection confocal images showing fixed neutrophils stimulated with (i), DMSO, (ii) 100 nM fMLF, equal volume of (iii) media, (iv) M1 CM or (v) M4 TCM, and stained for F-actin with phalloidin-TRITC (red) and nuclei with DAPI (blue). Scale bars are 12 µm. (C, D) Graphs depicting the circularity (C) and polarization (D) index of neutrophils stimulated with controls or equal volume of TCM derived from different breast cancer cell lines. Each dot represents corresponding value of a single neutrophil for each condition. (E) Cartoon depicting the neutrophil transwell migration assay. (F) Graph depicting the percentage of neutrophils that migrated into the bottom chamber of the transwells containing equal volume of CM from M1 cells or TCM from different breast cancer cell lines. Red and blue bars represent values of neutrophil migration obtained with TCM harvested from TNBC and ER+ cancer cell lines, respectively. Data shown are mean ± SEM from N=4 (C, D) or 3-15 (F) independent donors represented by individual dots. Each donor (N) represents an independent experiment. ****P ≤ 0.0001, ***P ≤ 0.001, *P ≤ 0.05 when compared with M1 CM (C, D, F) or ####P ≤ 0.0001 and ###P ≤ 0.001 when compared with MDA 231 TGL (one-way ANOVA with Dunnett’s multiple comparisons test).

