Figure 3.
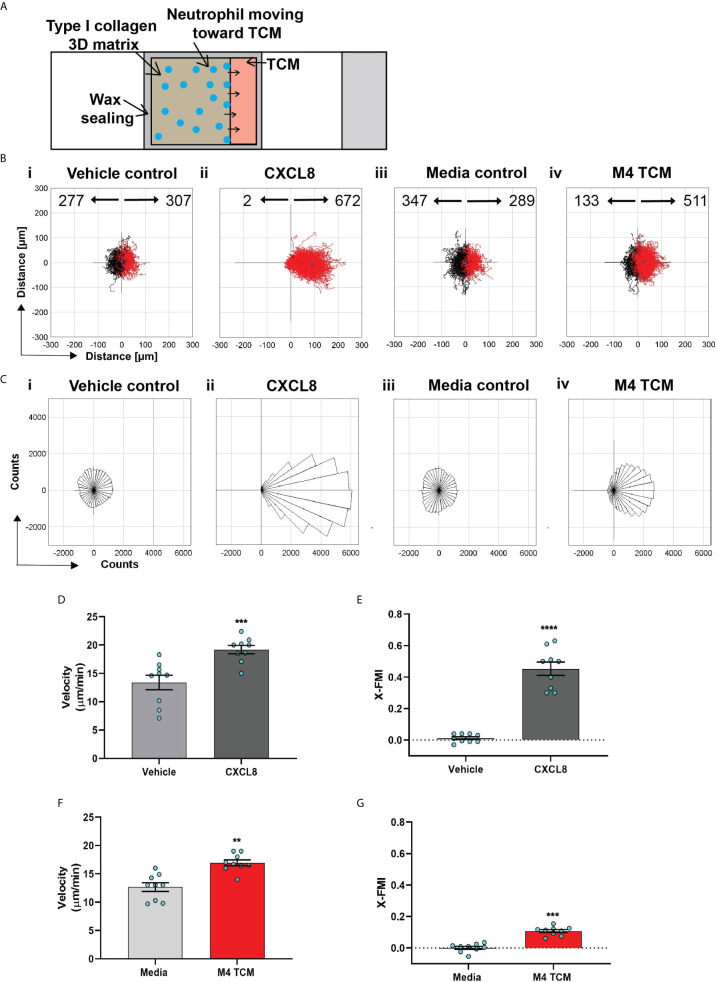
Neutrophils directionally migrate towards secreted factors harvested from TNBC cell line. (A) Cartoon depicting the migration chamber used to assess the chemotaxis of neutrophils in 3D collagen matrix towards TCM. (B, C) Plots showing individual cell tracks (B) and rose plots showing angle histograms of the migrating cells (C) generated from the combined tracks from N=3 independent donors in response to vehicle control (Bi, Ci), 500 nM CXCL8 (Bii, Cii), media control (Biii, Ciii), and M4 TCM (Biv, Civ). Numbers with left and right arrowhead in B represent number of neutrophils moving away and towards different conditions, respectively. (D–G) Graph depicting velocity (D, F) and X-FMI (E, G) of neutrophils migrating towards 500 nM CXCL8 and vehicle control (D, E) or M4 TCM and media (F, G). Each bar represents mean ± SEM from N=3 independent donors with each dot representing average values from independent positions. ****P < 0.0001, ***P ≤ 0.0005, **P ≤ 0.005 when compared with corresponding control (paired sample t-test).

