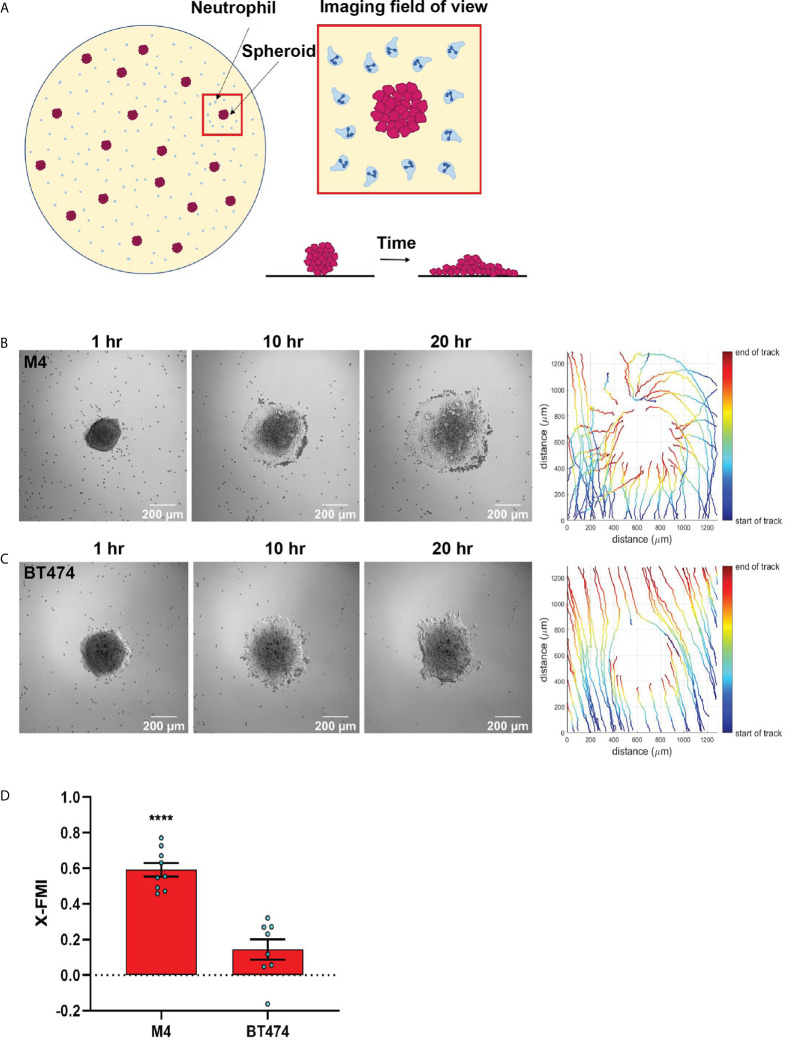
Figure 5.
TNBC spheroids actively recruit neutrophils. (A) Cartoon depicting the co-culture migration system used to assess the chemotaxis of neutrophils towards tumor spheroids in fibronectin coated glass-bottom plate. (B, C) Representative images of a neutrophil-spheroid co-culture migration assay at 1, 10, and 20 hrs with M4 spheroid (B) or BT474 spheroid (C) at the center of the field of view. Small, dark cells are neutrophils from the same donor. Representative tracks of neutrophils are on the right. (D) Graph depicting the X-FMI of neutrophils migrating towards M4 or BT474 spheroids. Each bar represents mean ± SEM from N= 3 (BT474 spheroid) or 4 (M4 spheroid) independent donors with each dot representing the average X-FMI for all neutrophils tracked per spheroid. An average of 45 neutrophils were tracked per spheroid. ****P < 0.0001 when compared with BT474 (unpaired t-test).

