Figure 6.

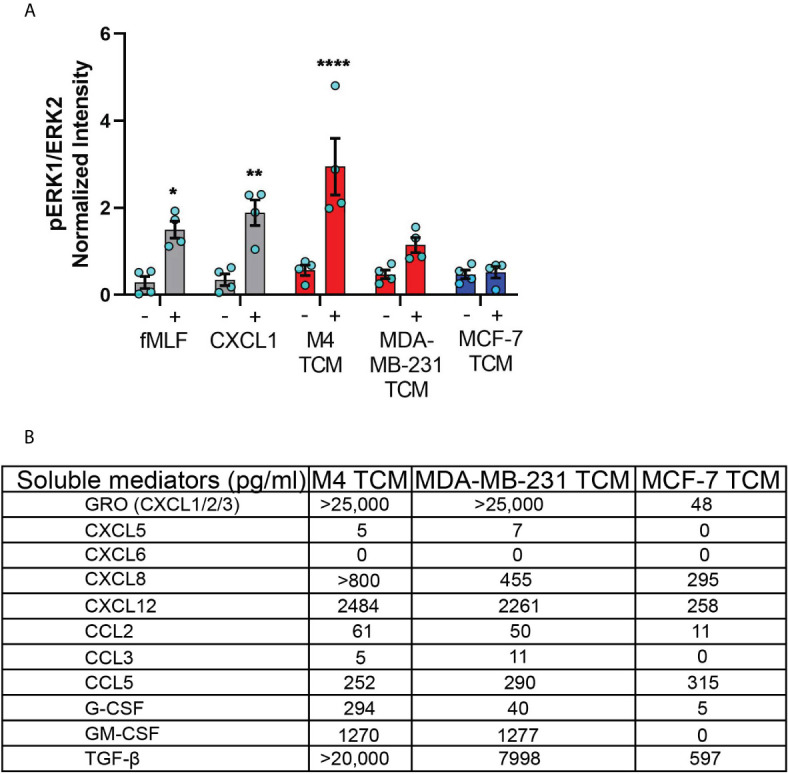
TNBC cell lines secrete neutrophil activating factors more abundantly than ER+ cancer cell lines. (A) Graph depicting pERK1/ERK2 intensity in neutrophils stimulated with controls (fMLF, CXCL1, media) or equal volume of TCM derived from M4, MDA-MB-231, or MCF-7 cells. The quantified pERK1/2 band intensity was normalized to α-tubulin and is shown as mean ± SEM from N=4 individual donors represented by each dot. ****P < 0.0001, **P ≤ 0.01, *P ≤ 0.05 when compared with corresponding vehicle controls (two-way ANOVA with Sidak multiple comparisons test). (B) Table showing the amount (pg/ml) of chemokines, growth factors and cytokines secreted by M4, MDA-MB-231 and MCF-7 cells determined by multiplex ELISA assay.
