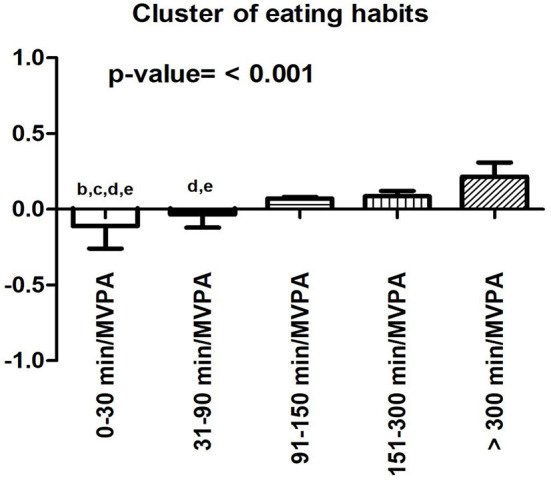
Figure 1.

Comparison of the food cluster during quarantine in COVID-19 in inactive and active participants. b, difference with 31–90 min/MVPA; c, difference with 91–150 min/MVPA; d, difference with 151–300 min/MVPA; e, difference with >300 min/MVPA. Adjusted by sex, age, education level, social isolation and BMI.
