Figure 2.

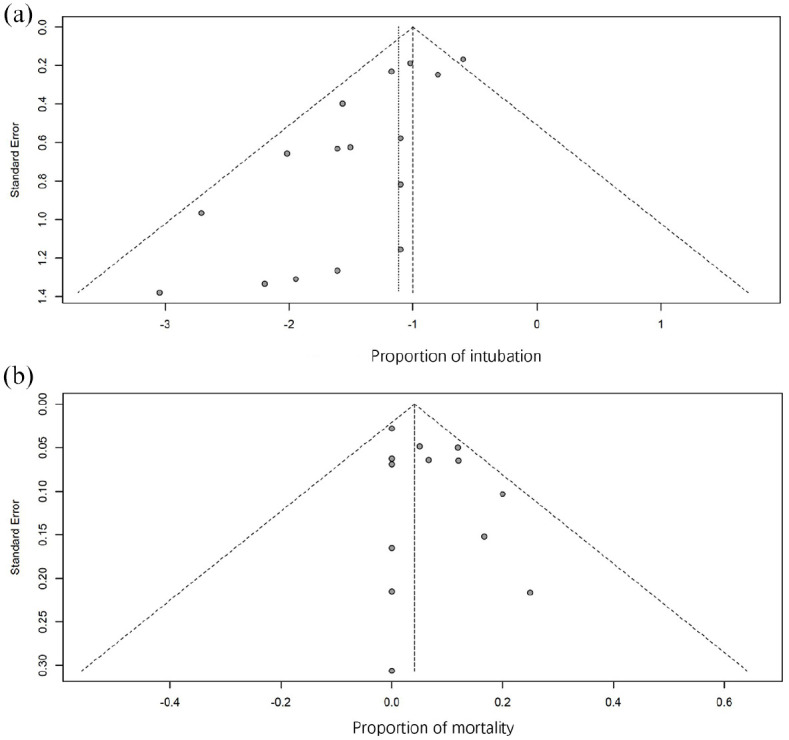
Funnel plots of the proportion versus the standard error of intubation proportion (a) and mortality proportion (b). Studies included in the meta-analysis are represented by the circles.

Funnel plots of the proportion versus the standard error of intubation proportion (a) and mortality proportion (b). Studies included in the meta-analysis are represented by the circles.