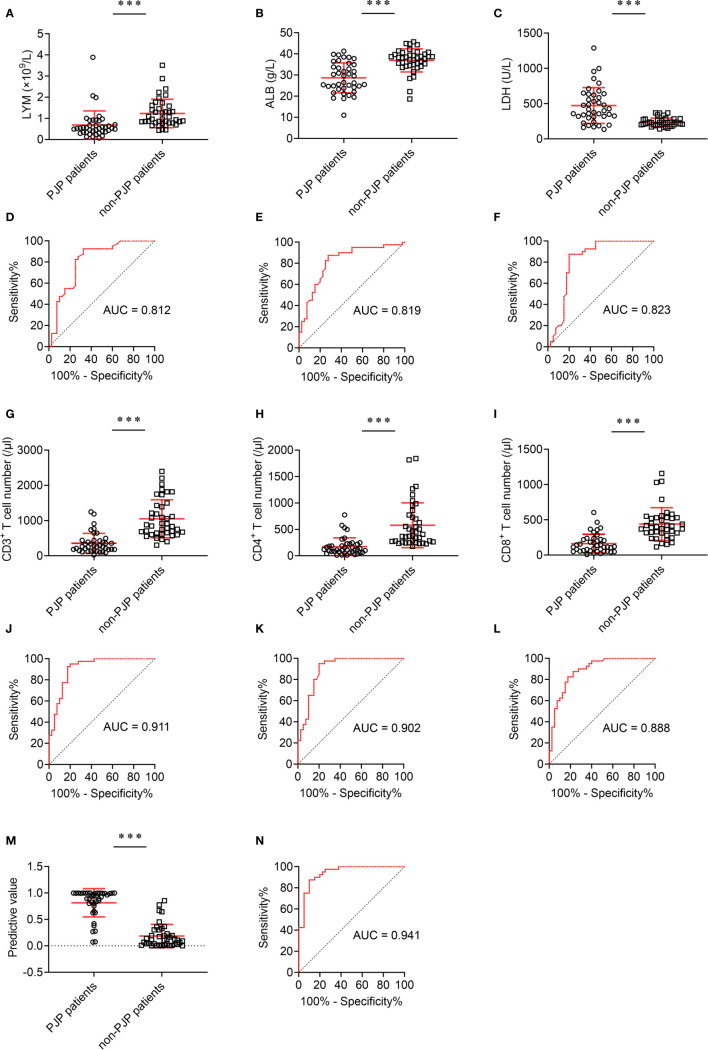
Figure 3.
The effect of different indicators on discriminating between PJP and non-PJP. (A) Scatter plots showing the values of LYM, (B) ALB, and (C) LDH in PJP and non-PJP patients. (D) ROC analysis showing the performance of LYM, (E) ALB, and (F) LDH in distinguishing PJP and non-PJP patients; (G) Scatter plots showing the values of CD3+ T cells, (H) CD4+ T cells, and (I) CD8+ T cells in PJP and non-PJP patients. (J) ROC analysis showing the performance of CD3+ T cells, (K) CD4+ T cells, and (L) CD8+ T cells in distinguishing PJP from non-PJP patients. (M) Scatter plots showing the value of the diagnostic model in PJP and non-PJP patients. (N) ROC analysis showing the performance of the diagnostic model in distinguishing PJP and non-PJP patients. Horizontal lines indicate the mean ± SD of each group. ***p < 0.001 (Mann-Whitney U test). LYM, lymphocytes; ALB, albumin; LDH, lactate dehydrogenase; AUC, area under the curve.

