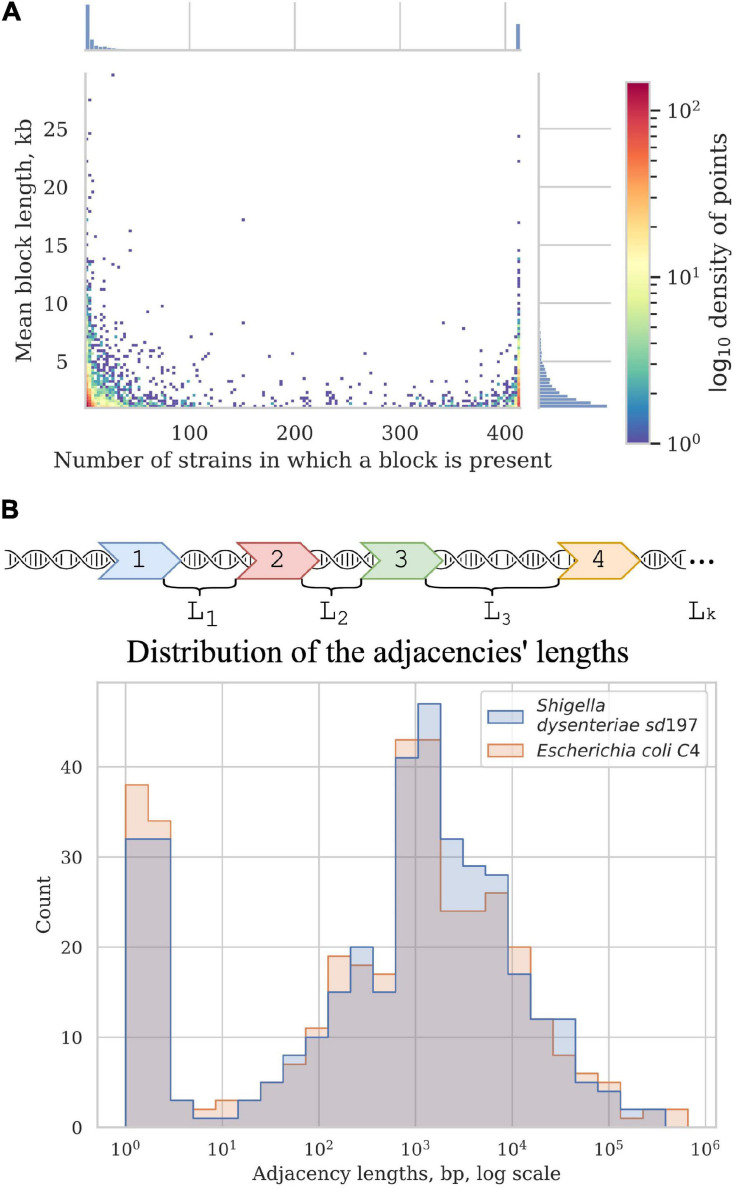
FIGURE 5.
Synteny blocks. (A) 2D histogram shows the relationship between the mean block length and the number of strains in which it is present. The colour of a point corresponds to the number of synteny blocks with these parameters. X-axis histogram shows the frequency distribution of the synteny blocks; Y-axis histogram shows the length distribution of the synteny blocks. (B) Distribution of the adjacencies’ lengths in E. coli and Shigella, in nucleotides. Adjacencies are defined as the chromosome regions between the neighbouring universal synteny blocks (see section “Materials and Methods”).

