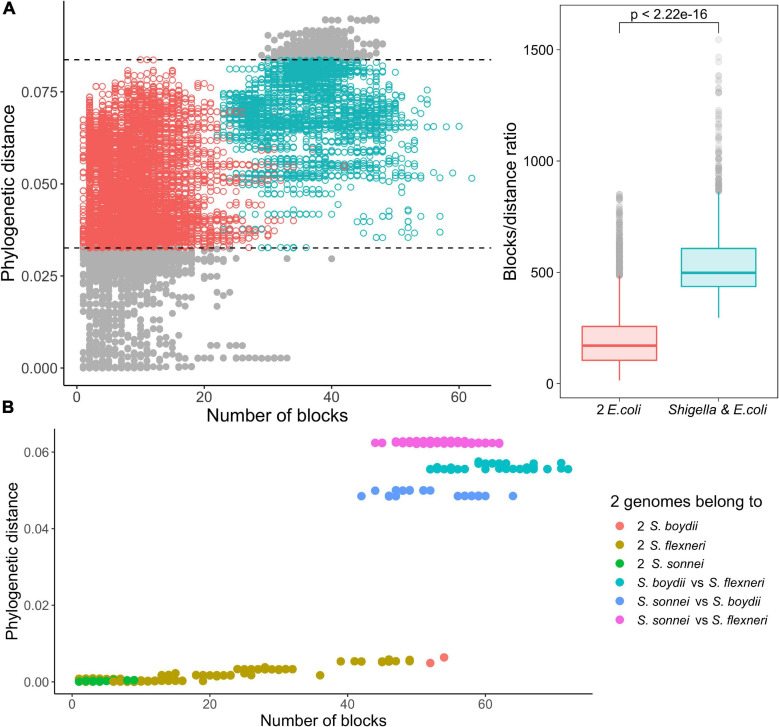
FIGURE 6.
Comparison of the ratio of phylogenetic distance to the number of synteny blocks for genome pairs from phylogroup B1. (A) Each pair consists of one Shigella spp. and one E. coli genome (the red dots) or two E. coli genomes (the green dots). Only genome pairs in the intersection were compared. The Wilcoxon–Mann–Whitney test p-value is given. (B) Each pair consists of two Shigella genomes.

