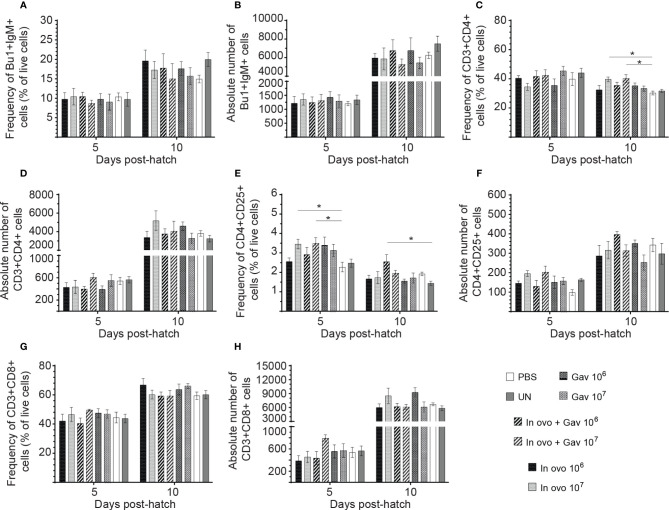
Figure 6.
Changes in the frequency of spleen lymphocytes cells mediated by lactobacilli inoculation. Spleen samples were collected at days 5 and 10 post-hatch from all treatment groups: groups 1 and 2 received 106 and 107 CFUs of lactobacilli cocktail in ovo, respectively, at embryonic day eighteen; groups 3 and 4 received 106 and 107 CFUs of lactobacilli, respectively, via both in ovo and oral gavage (on days 1, 7, 14, 21, 28 post-hatch); groups 5 and 6 received 106 and 107 CFUs of lactobacilli, respectively, via oral gavage; group 7 was served as a negative control group and was injected with phosphate-buffered saline (PBS); group 8 remained untreated (UN). Spleen mononuclear cells were stained and flow cytometric analysis was performed to determine the respective frequency and absolute numbers of B cells (Bu-1+ IgM+;A, B) and (C) T cell subsets (CD3+CD4+, CD3+CD4+CD25+, CD3+CD8+; C–H). Statistical significance among treatment groups was calculated using SAS Proc GLM (General Linear Model) followed by Tukey’s comparison test. Error bars represent standard errors of the mean. Results were considered statistically significant if P < 0.05. Bars with asterisks represent a significant difference among treatments. The data are representative samples from 6 individual birds.

