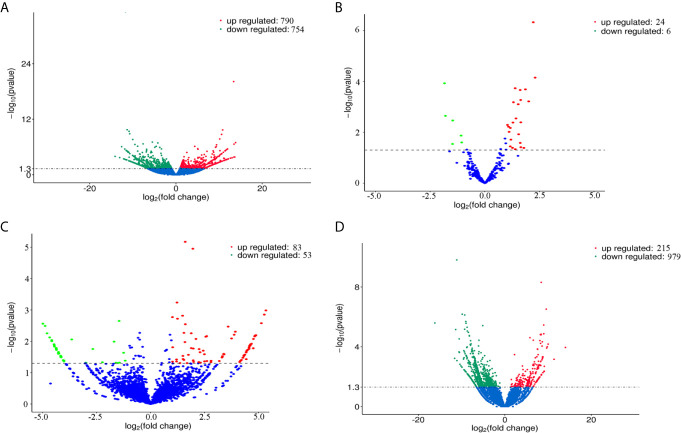
Figure 2.
Volcano plots showing the differentially expressed mRNAs (A), miRNAs (B), circRNAs (C), and lncRNAs (D) detected in goat PBMCs after treatment with F. gigantica ESPs. The negative log10 transformed P values (y-axis) are plotted against the average log2 fold changes in expression (x-axis). Data points representing RNAs that were not identified as differentially expressed are shown in blue. Transcripts that are differentially expressed after treatment with ESPs (corrected P value < 0.05) with an absolute log2 fold change (|FC|) greater than or less than 1 are shown as red (upregulated) and green (downregulated) dots.

